
Abstract:
The objective of this work was to evaluate the use of Landsat 8/OLI images to differentiate the age and estimate the total volume of Pinus elliottii, in order to determine the applicability of these data in the planning and management of forest activity. Fifty-three sampling units were installed, and dendrometric variables of 9-and-10-year-old P. elliottii commercial stands were measured. The digital numbers of the image were converted into surface reflectance and, subsequently, vegetation indices were determined. Red and near-infrared reflectance values were used to differentiate the ages of the stands. Regression analysis of the spectral variables was used to estimate the total volume. Increase in age caused an addition in reflectance in the near-infrared band and a decrease in the red band. The general equation for estimating the total volume for P.elliottii had an R2adj of 0.67 with a Syx of 31.46 m3 ha-1. Therefore, the spectral data with medium spatial resolution from the Landsat 8/OLI satellite can be used to distinguish the growth stages of the stands and can, thus, be used in the planning and proper management of forest activity on a spatial and temporal scale.
Index terms:
Pinus elliottii; remote sensing; vegetation indices; volume modeling.
Resumo:
O objetivo deste trabalho foi avaliar o uso de imagens Landsat 8/OLI na diferenciação da idade e na estimativa do volume total de Pinus elliottii, para determinar a aplicabilidade desses dados no planejamento e no manejo da atividade florestal. Foram instaladas 53 unidades amostrais e mensuradas as variáveis dendrométricas de povoamentos comerciais de P. elliottii aos 9 e 10 anos. Os números digitais da imagem foram convertidos à reflectância de superfície e, posteriormente, foram elaborados índices de vegetação. A diferenciação da idade dos povoamentos baseou-se nos valores de reflectância da banda do vermelho e do infravermelho próximo. A análise de regressão das variáveis espectrais foi utilizada na estimativa do volume total. O aumento da idade propiciou um acréscimo da reflectância na banda do infravermelho próximo e uma redução na banda do vermelho. A equação geral de estimativa do volume total para P. elliottii apresentou R2aj de 0,67 com Syx de 31,46 m3 ha-1. Dessa forma, os dados espectrais de média resolução espacial provenientes do satélite Landsat 8/OLI podem ser utilizados na distinção das fases de crescimento dos povoamentos sendo, portanto, passíveis de utilização no planejamento e no manejo adequado da atividade florestal em escala espacial e temporal.
Termos para indexação:
Pinus elliottii; sensoriamento remoto; índices de vegetação; modelagem do volume.
Introduction
The identification of tree species and the determination of the age of forest stands is traditionally carried out through field surveys (Goergen et al., 2016GOERGEN, L.C. de G.; KILCA, R. de V.; NARVAES, I. da S.; SILVA, M.N.; SILVA, E.A.; PEREIRA, R.S.; ADAMI, M. Distinção de espécies de eucalipto de diferentes idades por meio de imagens TM/Landsat 5. Pesquisa Agropecuária Brasileira, v.51, p.53-60, 2016. DOI: 10.1590/S0100-204X2016000100007.
https://doi.org/10.1590/S0100-204X201600...
), but the use of remote sensing techniques streamlines the process of acquiring and organizing information. The understanding of vegetation attributes led to the need for reliable mapping with the use of spectral data (Dube & Mutanga, 2015DUBE, T.; MUTANGA, O.; ABDEL-RAHMAN, E.M.; ISMAIL, R.; SLOTOW, R. Predicting Eucalyptus spp. stand volume in Zululand, South Africa: an analysis using a stochastic gradient boosting regression ensemble with multi-source data sets. International Journal of Remote Sensing, v.36, p.3751-3772, 2015. DOI: 10.1080/01431161.2015.1070316.
https://doi.org/10.1080/01431161.2015.10...
).
The regular and accurate observation of the forest status, including the monitoring of possible damage caused by nutrient deficiencies, water stress, or diseases, facilitates the development of strategies and management for each situation (Tillack et al., 2014TILLACK, A.; CLASEN, A.; KLEINSCHMIT, B.; FÖRSTER, M. Estimation of the seasonal leaf area index in an alluvial forest using high-resolution satellite-based vegetation indices. Remote Sensing of Environment, v.141, p.52-63, 2014. DOI: 10.1016/j.rse.2013.10.018.
https://doi.org/10.1016/j.rse.2013.10.01...
). Remote sensing of vegetation traits can be developed to obtain a spatial and temporal view of the variables of interest, such as leaf area index, biomass, and volume, among others (Zhang et al., 2014ZHANG, Y.; GUANTER, L.; BERRY, J.A.; JOINER, J.; VAN DER TOL, C.; HUETE, A.; GITELSON, A.; VOIGT, M.; KÖHLER, P. Estimation of vegetation photosynthetic capacity from space-based measurements of chlorophyll fluorescence for terrestrial biosphere models. Global Chang Biology, v.20, p.3727-3742, 2014. DOI: 10.1111/gcb.12664.
https://doi.org/10.1111/gcb.12664....
). According to Ponzoni et al. (2015)PONZONI, F.J.; PACHECO, L.R.F.; SANTOS, S.B. dos; ANDRADES FILHO, C. de O. Caracterização espectro-temporal de dosséis de Eucalyptus spp. mediante dados radiométricos TM/Landsat5. Cerne, v.21, p.267-275, 2015. DOI: 10.1590/01047760201521021457.
https://doi.org/10.1590/0104776020152102...
, the association of the spectral characteristics of an object with the physicochemical properties of the vegetation is done based on the radiometric variable and often using reflectance values.
Goergen et al. (2016)GOERGEN, L.C. de G.; KILCA, R. de V.; NARVAES, I. da S.; SILVA, M.N.; SILVA, E.A.; PEREIRA, R.S.; ADAMI, M. Distinção de espécies de eucalipto de diferentes idades por meio de imagens TM/Landsat 5. Pesquisa Agropecuária Brasileira, v.51, p.53-60, 2016. DOI: 10.1590/S0100-204X2016000100007.
https://doi.org/10.1590/S0100-204X201600...
used Landsat 5/TM data to differentiate species of Eucalyptus sp. by applying multivariate analysis techniques. Similarly, Van Aardt & Norris-Rogers (2008)VAN AARDT, J.A.N.; NORRIS-ROGERS, M. Spectral-age interactions in managed, even-aged Eucalyptus plantations: application of discriminant analysis and classification and regression trees approaches to hyperspectral data. International Journal of Remote Sensing, v.29, p.1841-1845, 2008. DOI: 10.1080/01431160701874546.
https://doi.org/10.1080/0143116070187454...
distinguished the age classes of Eucalyptus sp. and Acacia sp. stands based on Compact Airborne Spectrographic Imager (CASI) hyperspectral sensor data. Parameters such as vegetation behavior (Ponzoni et al., 2015PONZONI, F.J.; PACHECO, L.R.F.; SANTOS, S.B. dos; ANDRADES FILHO, C. de O. Caracterização espectro-temporal de dosséis de Eucalyptus spp. mediante dados radiométricos TM/Landsat5. Cerne, v.21, p.267-275, 2015. DOI: 10.1590/01047760201521021457.
https://doi.org/10.1590/0104776020152102...
; Goergen et al., 2016GOERGEN, L.C. de G.; KILCA, R. de V.; NARVAES, I. da S.; SILVA, M.N.; SILVA, E.A.; PEREIRA, R.S.; ADAMI, M. Distinção de espécies de eucalipto de diferentes idades por meio de imagens TM/Landsat 5. Pesquisa Agropecuária Brasileira, v.51, p.53-60, 2016. DOI: 10.1590/S0100-204X2016000100007.
https://doi.org/10.1590/S0100-204X201600...
), dendrometric and/or biophysical variables (Canavesi et al., 2010CANAVESI, V.; PONZONI, F.J.; VALERIANO, M.M. Estimativa de volume de madeira em plantios de Eucalyptus spp. utilizando dados hiperespectrais e dados topográficos. Revista Árvore, v.34, p.539-549, 2010. DOI: 10.1590/S0100-67622010000300018.
https://doi.org/10.1590/S0100-6762201000...
; Berra et al., 2014BERRA, E.F.; FONTANA, D.C.; PEREIRA, R.S. Accuracy of forest stem volume estimation by TM/Landsat Imagery with different geometric and atmospheric correction methods. International Journal of Applied Science and Technology, v.4, p.108-116, 2014.; Tillack et al., 2014TILLACK, A.; CLASEN, A.; KLEINSCHMIT, B.; FÖRSTER, M. Estimation of the seasonal leaf area index in an alluvial forest using high-resolution satellite-based vegetation indices. Remote Sensing of Environment, v.141, p.52-63, 2014. DOI: 10.1016/j.rse.2013.10.018.
https://doi.org/10.1016/j.rse.2013.10.01...
; Dube et al., 2015DUBE, T.; MUTANGA, O.; ABDEL-RAHMAN, E.M.; ISMAIL, R.; SLOTOW, R. Predicting Eucalyptus spp. stand volume in Zululand, South Africa: an analysis using a stochastic gradient boosting regression ensemble with multi-source data sets. International Journal of Remote Sensing, v.36, p.3751-3772, 2015. DOI: 10.1080/01431161.2015.1070316.
https://doi.org/10.1080/01431161.2015.10...
) and structural characteristics are some of the variables on which orbital data have been applied for the spectral characterization of vegetation cover.
Nowadays, there are numerous hyperspectral and multispectral products available, including data from the Lidar technology, which has produced spatial and spectral good quality information. However, according to Carreiras et al. (2012)CARREIRAS, J.M.B.; VASCONCELOS, M.J.; LUCAS, R.M. Understanding the relationship between aboveground biomass and ALOS PALSAR data in the forests of Guinea-Bissau (West Africa). Remote Sensing of Environment, v.121, p.426-442, 2012. DOI: 10.1016/j.rse.2012.02.012.
https://doi.org/10.1016/j.rse.2012.02.01...
, the applicability of these products is restricted due to the high cost involved in the acquisition, low spatial coverage, and the large volume of data for processing. Thus, it is impracticable to use these products for the characterization of biophysical parameters on a large scale.
In this context, Dube et al. (2015)DUBE, T.; MUTANGA, O.; ABDEL-RAHMAN, E.M.; ISMAIL, R.; SLOTOW, R. Predicting Eucalyptus spp. stand volume in Zululand, South Africa: an analysis using a stochastic gradient boosting regression ensemble with multi-source data sets. International Journal of Remote Sensing, v.36, p.3751-3772, 2015. DOI: 10.1080/01431161.2015.1070316.
https://doi.org/10.1080/01431161.2015.10...
highlighted the undergoing change in the selection of sensor data towards the use of broadband multispectral data, which includes greater coverage of images and free technology. Among the available products, the Landsat series offers free data and long-term time series, which is of great importance in the monitoring and evaluation of vegetation cover.
Aiming to continue this data collection, the National Aeronautics and Space Administration (Nasa) launched Landsat 8 satellite with two sensor instruments onboard: Operational Land Imager (OLI) and Thermal Infrared Sensor (TIRS) (Roy et al., 2014ROY, D.P.; WULDER, M.A.; LOVELAND, T.R.; WOODCOCK, C.E.; ALLEN, R.G.; ANDERSON, M.C.; HELDER, D.; IRONS, J.R.; JOHNSON, D.M.; KENNEDY, R.; SCAMBOS, T.A.; SCHAAF, C.B.; SCHOTT, J.R.; SHENG, Y.; VERMOTE, E.F.; BELWARD, A.S.; BINDSCHADLER, R.; COHEN, W.B.; GAO, F.; HIPPLE, J.D.; HOSTERT, P.; HUNTINGTON, J.; JUSTICE, C.O.; KILIC, A.; KOVALSKYY, V.; LEE, Z.P.; LYMBURNER, L.; MASEK, J.G.; MCCORKEL, J.; SHUAI, Y.; TREZZA, R.; VOGELMANN, J.; WYNNE, R.H.; ZHU, Z. Landsat-8: Science and product vision for terrestrial global change research. Remote Sensing of Environment, v.145, p.154-172, 2014. DOI: 10.1016/j.rse.2014.02.001.
https://doi.org/10.1016/j.rse.2014.02.00...
). This new satellite offers a greater range of coverage and spectral resolution than its predecessors, which can contribute to the understanding of vegetation behavior in the field.
The objective of this work was to evaluate the use of Landsat 8/OLI images to differentiate the age and estimate the total volume of Pinus elliottii Engelm, in order to determine the applicability of these data in the planning and management of forest activity.
Materials and Methods
The study area is located in the municipality of Rio Grande, in the Litoral Lagunar micro-region of the state of Rio Grande do Sul, Brazil (between latitudes 32º33'22" and 32º41'03"S and longitudes 52º30'29" and 52º25'20"W). The forest area is composed of P. elliottii and Eucalyptus grandis W. Hill.
According to the Köppen-Geiger classification, the area is under a humid subtropical climate (Cfa1), with average annual temperature of 16.5 to 18.0°C and average annual rainfall of 1,186 to 1,423 mm. The relief is flat in all its extension according to Shuttle Radar Topography Mission (SRTM) data. With regard to pedology, the soil was formed from quaternary sediments of Neossolo Quartzarênico (Quartzipsamment), with predominantly sandy characteristics.
The study was carried out in an area of 385.8 ha with 9-and-10-year-old P.elliottii trees spaced at 3x2 m. The planting was carried out in 2003 and 2004 in separate areas but in contiguous plots. The 9-year-old stands were planted in plots with sparse points of temporary water accumulation. This contributed to a lesser development of the individuals found in these locations.
A total of 25 sampling units (SU) were used in the 9-year-old stands and 28 SU in the 10-year-old stands. The 20x21 m (420 m2) rectangular SUs were systematically arranged every 5 ha. The diameter at breast height (DBH) and the total height of the individuals were measured in these units, so that the forest inventory was restricted to individuals with DBH equal to or greater than 10 cm within each SU. These variables were measured in August 2013. The total volume was calculated through allometric equations using the dendrometric variables measured in the inventory.
The spatial data used in this study were obtained free of cost from the Landsat 8/OLI sensor image on 8/30/2013 at orbit-point 221/083 from the United States Geological Survey (USGS). In this study, only the spectral bands with the best response to vegetation were used. Therefore, the following bands were part of the analyses: B2 (blue); B3 (green); B4 (red); B5 (near infrared); B6 (short wave infrared 1); and B7 (short wave infrared 2).
The images are available to users in digital numbers and, in order to relate to vegetation parameters, conversion to physical values (reflectance) is necessary. For this procedure, the Envi software, version 5.1 (Harris Geospatial Solutions, Broomfield, CO, USA), was used by means of the fast line-of-sight atmospheric analysis of spectral hypercubes (FLAASH) algorithm. This algorithm uses the Moderate Resolution Atmospheric Transmission (MODTRAN) model to characterize the atmosphere and eliminate effects caused by water vapor particles, aerosol and gases, based on predefined information about the satellite, the aerosol content and the atmospheric composition at the time the image was captured by the sensor. In this process, the average ground level was considered to be 15 m, using mid-latitude summer as the atmospheric model. The “rural” aerosol model was chosen, and a 100 km visibility at the time of imaging was established.
Spectral bands were used both individually and in combination, thus obtaining vegetation indices. The most relevant vegetation indices were used for forest cover analysis, as shown by Ponzoni et al. (2012)PONZONI, F.J.; SHIMABUKURO, Y.E.; KUPLICH, T.M. Sensoriamento remoto aplicado ao estudo da vegetação. 2.ed. atual. e ampl. São Paulo: Oficina de Textos, 2012. 160p. , Berra et al. (2014BERRA, E.F.; FONTANA, D.C.; PEREIRA, R.S. Accuracy of forest stem volume estimation by TM/Landsat Imagery with different geometric and atmospheric correction methods. International Journal of Applied Science and Technology, v.4, p.108-116, 2014.) and Goergen et al. (2016)GOERGEN, L.C. de G.; KILCA, R. de V.; NARVAES, I. da S.; SILVA, M.N.; SILVA, E.A.; PEREIRA, R.S.; ADAMI, M. Distinção de espécies de eucalipto de diferentes idades por meio de imagens TM/Landsat 5. Pesquisa Agropecuária Brasileira, v.51, p.53-60, 2016. DOI: 10.1590/S0100-204X2016000100007.
https://doi.org/10.1590/S0100-204X201600...
. Seven vegetation indices were determined, thus allowing the evaluation of different vegetation aspects, as well as their comparison in terms of performance and sensitivity (Table 1). Values of the spectral response attributes presented by B2, B3, B4, B5, B6 and B7 bands were extracted, and atmospherically resistant vegetation index (ARVI), difference vegetation index (DVI), green normalized difference vegetation index (GNDVI), moisture vegetation index (MVI), normalized difference vegetation index (NDVI), soil adjusted vegetation index in the soil effect minimization constants at 0.25 (SAVIL=0.25) and 0.50 (SAVIL=0.50), and simple ratio vegetation index (SR) were estimated.
The best responses of healthy vegetation to the electromagnetic spectrum are found in the near infrared and red bands (Ponzoni et al., 2012PONZONI, F.J.; SHIMABUKURO, Y.E.; KUPLICH, T.M. Sensoriamento remoto aplicado ao estudo da vegetação. 2.ed. atual. e ampl. São Paulo: Oficina de Textos, 2012. 160p. ). Thus, the spectral responses of the P. elliottii stands at different ages using red (B4) and near infrared (B5) bands were graphically arranged in the x and y plane, aiming to differentiate the growth stages.
Total volume and reflectance were represented by their respective averages, considering both the age difference between the samples and the whole set, including the two ages. Reflectance mean and standard deviation obtained from spectral variables were calculated using the R statistical software (R Core Team, 2016R CORE TEAM. R: a language and environment for statistical computing. Available at: <Available at: http://r-project.org
>. Accessed on: Nov. 30 2016.
http://r-project.org...
). According to Goergen et al. (2016)GOERGEN, L.C. de G.; KILCA, R. de V.; NARVAES, I. da S.; SILVA, M.N.; SILVA, E.A.; PEREIRA, R.S.; ADAMI, M. Distinção de espécies de eucalipto de diferentes idades por meio de imagens TM/Landsat 5. Pesquisa Agropecuária Brasileira, v.51, p.53-60, 2016. DOI: 10.1590/S0100-204X2016000100007.
https://doi.org/10.1590/S0100-204X201600...
, standard deviation is used to verify the internal change of the spectral variables in each plot.
The total volume for 9-and-10-year-old P.elliottii stands, as well as for a single data set, was estimated using a general equation for estimating the volume for the species. Data sets were divided into subsets, one for calibration and another for data validation, which was done based on six SU of each age through the chi-square test (X2) at a significance level of 95% probability.
Therefore, spectral variables were considered as the independent variable, and the total volume as the dependent variable in the model. Through stepwise estimation, spectral variables that contributed the most to the volume estimation model were selected. The model resulting from this process was evaluated considering the following statistical criteria: adjusted coefficient of determination (R2adj), standard error of the estimate (Syx), Furnival index (FI), and F-test at 5% probability.
Regression constraints were calculated. Therefore, the homogeneity of variance was evaluated by the Bartlett test, the normality of the residuals by the Shapiro-Wilk test and the independence of the residuals by the Durbin-Watson test.
Results and Discussion
The spectral response analysis in B4 and B5 bands showed that the stands behaved differently in each growth stage (Figure 1). It was found that increasing age led to an increased reflectance in B5 band and to a higher absorption in B4 band.

Spectral response of the 9-and-10-year-old Pinus elliottii stands according to the reflectance in B5 and B4 bands.
Clevers et al. (2008)CLEVERS, J.G.P.W.; KOOISTRA, L.; SCHAEPMAN, M.E. Using spectral information from the NIR water absorption features for the retrieval of canopy water content. International Journal of Applied Earth Observation and Geoinformation, v.10, p.388-397, 2008. DOI: 10.1016/j.jag.2008.03.003.
https://doi.org/10.1016/j.jag.2008.03.00...
state that a leaf area index increase causes reflectance increase in B5 band and higher leaf pigment absorption in the visible region due to the greater amount of photosynthetically active leaves present in the individual. According to Ponzoni et al. (2012)PONZONI, F.J.; SHIMABUKURO, Y.E.; KUPLICH, T.M. Sensoriamento remoto aplicado ao estudo da vegetação. 2.ed. atual. e ampl. São Paulo: Oficina de Textos, 2012. 160p. , this process is caused by the fact that reflectance in the near infrared region is associated with the internal leaf structure. Therefore, the more spaces in the internal leaf structure, the greater the reflectance in this region due to internal scattering. In turn, the visible region (blue, green, and red bands) is directly affected by the concentration of leaf pigments, because they absorb the electromagnetic radiation (EMR) for the production of photosynthesis, which is essential for plant survival and maintenance.
Based on field analysis and spectral data, it was observed that the stands under study are in the stages of canopy structure development and of adding business value. The 10-year-old stands have higher photosynthetic activity and a greater concentration of young leaves than the 9-year old stands, which thus reduces gaps in the canopy.
Therefore, the increase in reflectance in B5 band as the stands develop can be explained by the improvement in scattering caused by the presence of green leaves in the canopy formation and by its level of coverage (Jensen, 2009JENSEN, J.R. Sensoriamento remoto do ambiente: uma perspectiva em recursos terrestres. São José dos Campos: Parêntese, 2009. 604p.; Ponzoni et al., 2012PONZONI, F.J.; SHIMABUKURO, Y.E.; KUPLICH, T.M. Sensoriamento remoto aplicado ao estudo da vegetação. 2.ed. atual. e ampl. São Paulo: Oficina de Textos, 2012. 160p. ). In contrast, plants with high vegetative vigor absorb more EMR in B4 band (Jensen, 2009JENSEN, J.R. Sensoriamento remoto do ambiente: uma perspectiva em recursos terrestres. São José dos Campos: Parêntese, 2009. 604p.), which reveals the high photosynthetic activity, since leaf pigments absorb a greater amount of the radiation incident on the leaves, which is essential for their growth.
Carreiras et al. (2006)CARREIRAS, J.M.B.; PEREIRA, J.M.C.; PEREIRA, J.S. Estimation of tree canopy cover in evergreen oak woodlands using remote sensing. Forest Ecology and Management, v.223, p.45-53, 2006. DOI: 10.1016/j.foreco.2005.10.056.
https://doi.org/10.1016/j.foreco.2005.10...
found that the increase in canopy coverage, considering the same background class, led to an increase in reflectance in B5 band and a decrease in B4 band, as observed in Landsat data. This is why Jensen (2009)JENSEN, J.R. Sensoriamento remoto do ambiente: uma perspectiva em recursos terrestres. São José dos Campos: Parêntese, 2009. 604p. states that, as the canopy develops, pixel reflectance tends to suffer less interference from the soil line. This process results in higher reflectance in B5 band, since the forest understory and litter have great effect on the radiance that reaches the sensor in this spectrum range. The spectral response of P.elliottii in both ages is summed up in Table 2.
These results agree with those found by Ponzoni et al. (2012PONZONI, F.J.; SHIMABUKURO, Y.E.; KUPLICH, T.M. Sensoriamento remoto aplicado ao estudo da vegetação. 2.ed. atual. e ampl. São Paulo: Oficina de Textos, 2012. 160p. , 2015)PONZONI, F.J.; PACHECO, L.R.F.; SANTOS, S.B. dos; ANDRADES FILHO, C. de O. Caracterização espectro-temporal de dosséis de Eucalyptus spp. mediante dados radiométricos TM/Landsat5. Cerne, v.21, p.267-275, 2015. DOI: 10.1590/01047760201521021457.
https://doi.org/10.1590/0104776020152102...
and Jensen (2009)JENSEN, J.R. Sensoriamento remoto do ambiente: uma perspectiva em recursos terrestres. São José dos Campos: Parêntese, 2009. 604p. on vegetation behavior. In this sense, the Landsat 8 data show the trajectory of forest growth, including the monitoring of the increased plantations, as well as the proximity to stagnation, also detecting short-term (annual) variations.
Exploratory data analysis revealed the behavior of spectral variables (Table 3). The lowest reflectance values were observed in B2 and B4 bands, which agrees with the studies developed by Goergen et al. (2016)GOERGEN, L.C. de G.; KILCA, R. de V.; NARVAES, I. da S.; SILVA, M.N.; SILVA, E.A.; PEREIRA, R.S.; ADAMI, M. Distinção de espécies de eucalipto de diferentes idades por meio de imagens TM/Landsat 5. Pesquisa Agropecuária Brasileira, v.51, p.53-60, 2016. DOI: 10.1590/S0100-204X2016000100007.
https://doi.org/10.1590/S0100-204X201600...
and López-Serrano et al. (2016)LÓPEZ-SERRANO, P.M.; SÁNCHEZ, C.A.L.; SOLÍS-MORENO, R.; CORRAL-RIVAS, J.J. Geospatial estimation of above ground forest biomass in the Sierra Madre Occidental in the State of Durango, Mexico. Forests, v.7, p.70, 2016. DOI: 10.3390/f7030070.
https://doi.org/10.3390/f7030070....
. The fact that these wavelengths are associated with the increased absorption of EMR incident on the plant for photosynthesis explains this finding (Jensen, 2009JENSEN, J.R. Sensoriamento remoto do ambiente: uma perspectiva em recursos terrestres. São José dos Campos: Parêntese, 2009. 604p.; Ponzoni et al., 2012PONZONI, F.J.; SHIMABUKURO, Y.E.; KUPLICH, T.M. Sensoriamento remoto aplicado ao estudo da vegetação. 2.ed. atual. e ampl. São Paulo: Oficina de Textos, 2012. 160p. ; Feilhauer et al., 2015FEILHAUER, H.; ASNER G.P.; MARTIN, R.E. Multi-method ensemble selection of spectral bands related to leaf biochemistry. Remote Sensing of Environment, v.164, p.57-65, 2015. DOI: 10.1016/j.rse.2015.03.033.
https://doi.org/10.1016/j.rse.2015.03.03...
). Regarding the spectral bands, the greatest deviations are found in B5, but, among the vegetation indices, the highest variation was detected in the SR index.
In the analysis of regression constraints, 9-year-old stands exhibited variance homogeneity with a non-significant relationship (p = 0.770). The null hypothesis was accepted in the normality test (p = 0.106) and in the independence of residuals (p = 0.0250). This same behavior was found for 10-year-old stands, which met the assumption of regression constraints, presenting a probability of 0.1491 for homogeneity, 0.9043 for independence and 0.2671 for the normality of residuals.
The variables selected by the stepwise method in the process of modeling P. elliottii stand volume are shown in Table 4. For 9-year-old stands, the most accurate model presented B5 band as the independent variable in its original form and converted to natural logarithm. This regression model showed an R2adj of 0.71, including an estimation error of 29.39 m3 ha-1 and FI of 44.77 m3 ha-1. For 10-year-old stands, the independent variable was DVI, presenting an R2adj of 0.72, Syx of 18.80 m3 ha-1 and FI of 29.41 m3 ha-1. The general equation containing the 9-and-10-year-old SU stands showed a lower fit in comparison with the equations above, with an R2adj of 0.67, Syx of 31.46 m3 h-1, and FI of 49.21 m3 ha-1.
Chi-square test (X2) to validate the equations resulted in calculated X2 values lower than the tabulated X2 value, so that one can infer that there was no significant difference between the actual and the estimated values. This was identified in all the fitted equations.
Although the fitted models for both ages exhibited close values, spectral variables showed better results for the 10-year-old stands. The results of the present study show that less canopy coverage is a negative factor in the modeling process with spatial data.
The 9-year-old plantations had less canopy closure compared with the 10-year-old ones, which was attributed to age. This factor resulted in a greater interference of litter in the spectral response stored by OLI sensor. In sparse locations, the presence of temporary flooding points contributed to the reduced canopy closure, causing the greatest litter effect on the reflectance value of the SU. Ponzoni et al. (2015)PONZONI, F.J.; PACHECO, L.R.F.; SANTOS, S.B. dos; ANDRADES FILHO, C. de O. Caracterização espectro-temporal de dosséis de Eucalyptus spp. mediante dados radiométricos TM/Landsat5. Cerne, v.21, p.267-275, 2015. DOI: 10.1590/01047760201521021457.
https://doi.org/10.1590/0104776020152102...
state that, when the vegetation cover is not homogeneous, factors such as litter, forest understory, and dry branches will have greater impact on the spectral response.
The sampled stands in this study were the same used by Berra (2013)BERRA, E.F. Avaliação e comparação de imagens LISS-III/ResourceSAT-1 e TM/LANDSAT 5 para estimar volume de madeira de um plantio de Pinus elliottii. 2013. 127p. Dissertação (Mestrado) - Universidade Federal do Rio Grande do Sul, Porto Alegre. in volume estimation studies when the two stands were 6 and 7 years old, based on Landsat 5/TM and ResourceSat-1/LISS-III spectral data. The total volume was explained by B3 and B5 bands for the LISS-III sensor, with R2adj of 0.72 and Syx of 24.60 m3 ha-1. For the TM sensor, the variables selected in the model were B3, B5, and B6 bands, comprising 70% of the data variability with Syx of 25.24 m3 ha-1.
Persson (2016)PERSSON, H.J. Estimation of Boreal Forest Attributes from Very High Resolution Pléiades Data. Remote Sensing, v.8, p.736, 2016. DOI: 10.3390/rs8090736.
https://doi.org/10.3390/rs8090736....
used Pleiades data to estimate forest attributes, and found that volume and basal area estimates were highly correlated; R2 values were 0.73 and 0.77, while errors were 25.4 and 26.9%, respectively. Sousa & Ponzoni (1998)SOUSA, C.L.; PONZONI, F.J. Avaliação de índices de vegetação e de bandas TM/Landsat para estimativa de volume de madeira em floresta implantada de Pinus spp. In: SIMPÓSIO BRASILEIRO DE SENSORIAMENTO REMOTO, 9., 1998, Santos. Anais. São José dos Campos: INPE, 1998. estimated the total timber volume of Pinus spp. from Landsat 5/TM data and showed that the dependent variable is explained by GNDVI and MVI.
The graphical analysis of residuals showed that the residual amplitude within the model selected to estimate the volume of 9-year-old stands was approximately 75 m3 ha-1 (Figure 2 A), and the estimated values ranged from 100 to 250 m3 ha-1. However, the model for 10-year-old stands exhibited less deviations (of approximately 40 m3 ha-1), with estimated volumes in the area under study ranging from 160 to 260 m3 ha-1 (Figure 2 B), while the general equation showed deviations close to 100 m3 -1ha (Figure 2 C).
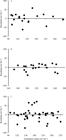
Distribution of residuals within the equations for 9-year-old (A) and 10-year-old stands (B), and general equation (C).
This study showed a lesser residual amplitude than the results presented by Berra (2013)BERRA, E.F. Avaliação e comparação de imagens LISS-III/ResourceSAT-1 e TM/LANDSAT 5 para estimar volume de madeira de um plantio de Pinus elliottii. 2013. 127p. Dissertação (Mestrado) - Universidade Federal do Rio Grande do Sul, Porto Alegre., who found deviations equal to or greater than 75 m3 ha-1. The radiometric resolution of the sensors stands out for its sensitivity in detecting the radiation intensity, which interferes with the scale of distribution of gray levels. The images obtained by the OLI sensor have a 16-bit (216) radiometric resolution, so as to record differences in vegetation in a gray level scale ranging from 0 to 65535, while the TM sensor records differences in the range of 0 to 256 (28) gray levels. The Landsat 8/OLI data is valuable for research, planning and proper management of forest activity, especially in future forest inventories, for its great relevance in SU allocation, which makes it possible to reduce forest production costs.
Conclusions
-
The spectral data of the Landsat 8/OLI images proved to be efficient in differentiating the ages of P. elliottii stands, and may possibly serve as the basis for the spectral-temporal characterization of the canopies on spatial and temporal scales.
-
The spectral variables with the best response to the volume of P.elliottii are the B5 band and the DVI.
Acknowledgments
To Coordenação de Aperfeiçoamento de Pessoal de Nível Superior (Capes), for scholarships granted.
References
- BERRA, E.F. Avaliação e comparação de imagens LISS-III/ResourceSAT-1 e TM/LANDSAT 5 para estimar volume de madeira de um plantio de Pinus elliottii 2013. 127p. Dissertação (Mestrado) - Universidade Federal do Rio Grande do Sul, Porto Alegre.
- BERRA, E.F.; FONTANA, D.C.; PEREIRA, R.S. Accuracy of forest stem volume estimation by TM/Landsat Imagery with different geometric and atmospheric correction methods. International Journal of Applied Science and Technology, v.4, p.108-116, 2014.
- CANAVESI, V.; PONZONI, F.J.; VALERIANO, M.M. Estimativa de volume de madeira em plantios de Eucalyptus spp. utilizando dados hiperespectrais e dados topográficos. Revista Árvore, v.34, p.539-549, 2010. DOI: 10.1590/S0100-67622010000300018.
» https://doi.org/10.1590/S0100-67622010000300018. - CARREIRAS, J.M.B.; PEREIRA, J.M.C.; PEREIRA, J.S. Estimation of tree canopy cover in evergreen oak woodlands using remote sensing. Forest Ecology and Management, v.223, p.45-53, 2006. DOI: 10.1016/j.foreco.2005.10.056.
» https://doi.org/10.1016/j.foreco.2005.10.056. - CARREIRAS, J.M.B.; VASCONCELOS, M.J.; LUCAS, R.M. Understanding the relationship between aboveground biomass and ALOS PALSAR data in the forests of Guinea-Bissau (West Africa). Remote Sensing of Environment, v.121, p.426-442, 2012. DOI: 10.1016/j.rse.2012.02.012.
» https://doi.org/10.1016/j.rse.2012.02.012. - CLEVERS, J.G.P.W. The derivation of a simplified reflectance model for the estimation of leaf area index. Remote Sensing of Environment, v.25, p.53-69, 1988. DOI: 10.1016/0034-4257(88)90041-7.
» https://doi.org/10.1016/0034-4257(88)90041-7. - CLEVERS, J.G.P.W.; KOOISTRA, L.; SCHAEPMAN, M.E. Using spectral information from the NIR water absorption features for the retrieval of canopy water content. International Journal of Applied Earth Observation and Geoinformation, v.10, p.388-397, 2008. DOI: 10.1016/j.jag.2008.03.003.
» https://doi.org/10.1016/j.jag.2008.03.003. - DUBE, T.; MUTANGA, O.; ABDEL-RAHMAN, E.M.; ISMAIL, R.; SLOTOW, R. Predicting Eucalyptus spp stand volume in Zululand, South Africa: an analysis using a stochastic gradient boosting regression ensemble with multi-source data sets. International Journal of Remote Sensing, v.36, p.3751-3772, 2015. DOI: 10.1080/01431161.2015.1070316.
» https://doi.org/10.1080/01431161.2015.1070316. - FEILHAUER, H.; ASNER G.P.; MARTIN, R.E. Multi-method ensemble selection of spectral bands related to leaf biochemistry. Remote Sensing of Environment, v.164, p.57-65, 2015. DOI: 10.1016/j.rse.2015.03.033.
» https://doi.org/10.1016/j.rse.2015.03.033. - GOERGEN, L.C. de G.; KILCA, R. de V.; NARVAES, I. da S.; SILVA, M.N.; SILVA, E.A.; PEREIRA, R.S.; ADAMI, M. Distinção de espécies de eucalipto de diferentes idades por meio de imagens TM/Landsat 5. Pesquisa Agropecuária Brasileira, v.51, p.53-60, 2016. DOI: 10.1590/S0100-204X2016000100007.
» https://doi.org/10.1590/S0100-204X2016000100007. - HUETE, A.R.; JACKSON, R.D.; POST, D.F. Spectral response of a plant canopy with different soil background. Remote Sensing of Environment, v.17, p.37-53, 1985. DOI: 10.1016/0034-4257(85)90111-7.
» https://doi.org/10.1016/0034-4257(85)90111-7. - JENSEN, J.R. Sensoriamento remoto do ambiente: uma perspectiva em recursos terrestres. São José dos Campos: Parêntese, 2009. 604p.
- JORDAN, C.F. Derivation of Leaf-Area Index from Quality of Light on the Forest Floor. Ecology, v.50, p.663-666, 1969. DOI: 10.2307/1936256.
» https://doi.org/10.2307/1936256. - KAUFMAN, Y.J.; TANRÉ, D. Atmospherically resistant vegetation index (ARVI) for EOS-MODIS. IEEE Transactions on Geoscience and Remote Sensing, v.30, p.261-270, 1992. DOI: 10.1109/36.134076.
» https://doi.org/10.1109/36.134076. - LÓPEZ-SERRANO, P.M.; SÁNCHEZ, C.A.L.; SOLÍS-MORENO, R.; CORRAL-RIVAS, J.J. Geospatial estimation of above ground forest biomass in the Sierra Madre Occidental in the State of Durango, Mexico. Forests, v.7, p.70, 2016. DOI: 10.3390/f7030070.
» https://doi.org/10.3390/f7030070. - PERSSON, H.J. Estimation of Boreal Forest Attributes from Very High Resolution Pléiades Data. Remote Sensing, v.8, p.736, 2016. DOI: 10.3390/rs8090736.
» https://doi.org/10.3390/rs8090736. - PONZONI, F.J.; PACHECO, L.R.F.; SANTOS, S.B. dos; ANDRADES FILHO, C. de O. Caracterização espectro-temporal de dosséis de Eucalyptus spp. mediante dados radiométricos TM/Landsat5. Cerne, v.21, p.267-275, 2015. DOI: 10.1590/01047760201521021457.
» https://doi.org/10.1590/01047760201521021457. - PONZONI, F.J.; SHIMABUKURO, Y.E.; KUPLICH, T.M. Sensoriamento remoto aplicado ao estudo da vegetação. 2.ed. atual. e ampl. São Paulo: Oficina de Textos, 2012. 160p.
- R CORE TEAM. R: a language and environment for statistical computing. Available at: <Available at: http://r-project.org >. Accessed on: Nov. 30 2016.
» http://r-project.org - ROUSE JR., J.W.; HAAS, R.H.; DEERING, D.W.; SCHELL, J.A. Monitoring the vernal advancement and retrogradation (green wave effect) of natural vegetation. College Station: Texas A&M University, 1974. 87p. (Progress Report RSC 1978-2).
- ROY, D.P.; WULDER, M.A.; LOVELAND, T.R.; WOODCOCK, C.E.; ALLEN, R.G.; ANDERSON, M.C.; HELDER, D.; IRONS, J.R.; JOHNSON, D.M.; KENNEDY, R.; SCAMBOS, T.A.; SCHAAF, C.B.; SCHOTT, J.R.; SHENG, Y.; VERMOTE, E.F.; BELWARD, A.S.; BINDSCHADLER, R.; COHEN, W.B.; GAO, F.; HIPPLE, J.D.; HOSTERT, P.; HUNTINGTON, J.; JUSTICE, C.O.; KILIC, A.; KOVALSKYY, V.; LEE, Z.P.; LYMBURNER, L.; MASEK, J.G.; MCCORKEL, J.; SHUAI, Y.; TREZZA, R.; VOGELMANN, J.; WYNNE, R.H.; ZHU, Z. Landsat-8: Science and product vision for terrestrial global change research. Remote Sensing of Environment, v.145, p.154-172, 2014. DOI: 10.1016/j.rse.2014.02.001.
» https://doi.org/10.1016/j.rse.2014.02.001. - SOUSA, C.L.; PONZONI, F.J. Avaliação de índices de vegetação e de bandas TM/Landsat para estimativa de volume de madeira em floresta implantada de Pinus spp. In: SIMPÓSIO BRASILEIRO DE SENSORIAMENTO REMOTO, 9., 1998, Santos. Anais. São José dos Campos: INPE, 1998.
- TILLACK, A.; CLASEN, A.; KLEINSCHMIT, B.; FÖRSTER, M. Estimation of the seasonal leaf area index in an alluvial forest using high-resolution satellite-based vegetation indices. Remote Sensing of Environment, v.141, p.52-63, 2014. DOI: 10.1016/j.rse.2013.10.018.
» https://doi.org/10.1016/j.rse.2013.10.018. - VAN AARDT, J.A.N.; NORRIS-ROGERS, M. Spectral-age interactions in managed, even-aged Eucalyptus plantations: application of discriminant analysis and classification and regression trees approaches to hyperspectral data. International Journal of Remote Sensing, v.29, p.1841-1845, 2008. DOI: 10.1080/01431160701874546.
» https://doi.org/10.1080/01431160701874546. - ZHANG, Y.; GUANTER, L.; BERRY, J.A.; JOINER, J.; VAN DER TOL, C.; HUETE, A.; GITELSON, A.; VOIGT, M.; KÖHLER, P. Estimation of vegetation photosynthetic capacity from space-based measurements of chlorophyll fluorescence for terrestrial biosphere models. Global Chang Biology, v.20, p.3727-3742, 2014. DOI: 10.1111/gcb.12664.
» https://doi.org/10.1111/gcb.12664.
Publication Dates
-
Publication in this collection
Nov 2017
History
-
Received
06 Dec 2016 -
Accepted
24 Mar 2017


