Abstracts
OBJECTIVE: To examine time trends in physical activity (PA) in Brazilian state capitals from 2006 to 2009. METHODS: This analysis is based on data from the Telephone-based Surveillance of Risk and Protective Factors for Chronic Diseases (VIGITEL) accounting for an annual sample of approximately 54,000 individuals. PA indicators were analyzed in free time (leisure), work, home and transportation, time spent in front of the television and inactivity considering all PA domains. Poisson regression models were used to measure the variation of indicators over time. We considered the changes corresponding to a regression coefficient different from zero as being statistically significant (p<0.05). RESULTS: The percentage of active commuters increased from 11.7 to 14.4% (p<0.001) whereas the proportion of physically inactive individuals in the four domains decreased from 11.7 to 8.7% (p<0.001). There were no significant changes in the other indicators. Women were less active than men in all indicators, except for household chores. However, in this indicator the percentage of active women decreased from 71.4 to 67.1% (p<0.001). Between 2006 and 2009, PA levels in the Brazilian population were stable during free time and household chores, but increased in transportation, resulting in a decrease in the percentage of inactive individuals. CONCLUSION: The continued monitoring and strengthening of VIGITEL are public health priorities, and PA is a key part of it. In the long run, PA evolution may be re-evaluated.
motor activity; population surveillance; epidemiology; developing countries; walking; sports
OBJETIVO: Analisar as tendências temporais de atividade física (AF) nas capitais brasileiras entre 2006 e 2009. MÉTODOS: A análise apresentada neste artigo é baseada nos dados do VIGITEL, totalizando uma amostra anual aproximada de 54.000 indivíduos. Foram analisados indicadores de AF no tempo livre, trabalho, em casa e no deslocamento, além do tempo assistindo à televisão e de inatividade considerando todos os domínios de AF. A variação dos indicadores no período foi aferida por meio de modelos de regressão de Poisson, tendo como variável explanatória o ano do inquérito. Foi considerada significativa a evolução correspondente a um coeficiente de regressão diferente de zero (p<0,05). RESULTADOS: O percentual de indivíduos ativos no deslocamento passou de 11,7 para 14,4% (p<0,001), enquanto aqueles fisicamente inativos nos quatro domínios passaram de 11,7 para 8,7% (p<0,001). Não foram observadas oscilações significantes nos demais indicadores. As mulheres foram menos ativas em todos os indicadores, exceto nos serviços domésticos. Neste domínio, houve redução das mulheres ativas de 71,4 para 67,1% (p<0,001). Os níveis de AF da população brasileira entre 2006 e 2009 estão estáveis no tempo livre e nas atividades domésticas, mas aumentaram no deslocamento, acarretando uma diminuição no percentual de inativos no país. CONCLUSÃO: A continuidade do monitoramento e o fortalecimento do VIGITEL se colocam como prioridades e a área de AF se insere neste crescimento, e no longo prazo, poderá ter sua evolução temporal novamente avaliada.
atividade motora; vigilância da população; epidemiologia; países em desenvolvimento; caminhada; esportes
ARTICLES
IPhysical Activity Epidemiology Study Group - Universidade Federal de Pelotas (UFPel) - Pelotas (RS), Brazil
IIPost Graduation Program of Epidemiology at Universidade Federal de Pelotas (UFPel) - Pelotas (RS), Brazil
IIIPost Graduation Program of Physical Education at Universidade Federal de Pelotas (UFPel) - Pelotas (RS), Brazil
IVPhysical Activity and Quality of Life Research Group - Pontifícia Universidade Católica do Paraná (PUCPR) - Curitiba (PR), Brazil
VGeneral Coordination of Non Communicable Diseases and Conditions - Ministry of Health- Brasília (DF), Brazil
VINursing Post Graduation Program at Universidade Federal de Minas Gerais (UFMG) - Belo Horizonte (MG), Brazil
VIIDepartment of Epidemiology at Faculdade de Saúde Pública of Universidade de São Paulo (FSP/USP) - São Paulo (SP), Brazil
VIIIEscola de Artes, Ciências e Humanidades (EACH) at Universidade de São Paulo (USP) - São Paulo (SP), Brazil
Correspondence to
ABSTRACT
OBJECTIVE: To examine time trends in physical activity (PA) in Brazilian state capitals from 2006 to 2009.
METHODS: This analysis is based on data from the Telephone-based Surveillance of Risk and Protective Factors for Chronic Diseases (VIGITEL) accounting for an annual sample of approximately 54,000 individuals. PA indicators were analyzed in free time (leisure), work, home and transportation, time spent in front of the television and inactivity considering all PA domains. Poisson regression models were used to measure the variation of indicators over time. We considered the changes corresponding to a regression coefficient different from zero as being statistically significant (p<0.05).
RESULTS: The percentage of active commuters increased from 11.7 to 14.4% (p<0.001) whereas the proportion of physically inactive individuals in the four domains decreased from 11.7 to 8.7% (p<0.001). There were no significant changes in the other indicators. Women were less active than men in all indicators, except for household chores. However, in this indicator the percentage of active women decreased from 71.4 to 67.1% (p<0.001). Between 2006 and 2009, PA levels in the Brazilian population were stable during free time and household chores, but increased in transportation, resulting in a decrease in the percentage of inactive individuals.
CONCLUSION: The continued monitoring and strengthening of VIGITEL are public health priorities, and PA is a key part of it. In the long run, PA evolution may be re-evaluated.
Keywords: motor activity; population surveillance; epidemiology; developing countries; walking; sports.
Introduction
International scientific literature has shown a progressive decrease in occupational physical activity (PA) levels1. As to the practice of PA during leisure time, there is apparent time stability; some European countries have detected increased levels of PA in the past few years1. Unfortunately, such data are almost exclusively related to high income countries. Unlike developed countries, in those with middle or low income, like Brazil, the rates of total PA represented by activities performed during leisure time are lower2. In these places, the practice of PA related to means of transportation, household chores and occupational PA represent a substantial fraction of total PA. Therefore, data from high income countries regarding PA are not fit for the Brazilian context.
Scientific articles concerning time trends of PA in Brazil are still rare. In the city of Pelotas, Rio Grande do Sul3, the percentage of active individuals decreased as to the four spheres of PA between 2002 and 2007. In the state of São Paulo4, a recent study reported increased levels of total PA, especially due to the increase rates of walking practice and moderate PA.
With the consolidation of Telephone-based Surveillance of Risk and Protective Factors for Chronic Diseases (VIGITEL), of the Ministry of Health, national data on PA for adults aged 18 years or more have been available since 2006. The objective of this study was to analyze time trends of PA in the Brazilian capitals from 2006 to 2009.
Methods
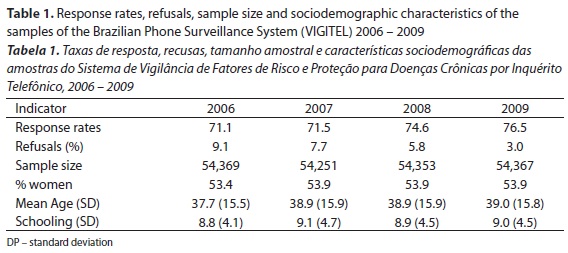
The analysis presented in this article is based on data from VIGITEL, concerning the years 2006 to 2009. The detailed methodology of these surveys is available in previous publications5,6. To sum up, about 2,000 adults (aged 18 years or more) are annually interviewed in each of the 26 Brazilian state capitals and the Federal District, accounting for an annual sample of approximately 54,000 individuals. The random and stratified sample in each capital is based on the registration of landline telephone lines. Table 1 describes the success rates of the interviews, the percentage of refusals and the final sample size of each of the surveys conducted from 2006 to 2009.
The practice of PA has been assessed in its four domains5. Leisure-time physical activity is measured by a question on the main physical exercise or sport practiced by the interview, plus information on weekly frequency and length of time. Occupational PA is estimated with questions related to lifting weight and walking during the work hours. Commuting PA is measured with specific questions about the transportation used to go to work. Finally, the individual is asked whether or not he or she is responsible for cleaning their houses. Besides questions related to PA, VIGITEL analyzed the mean time spent in front of the television on a typical day, which results in an indicator of sedentary lifestyle. In 2009, a new set of questions about PA was added, regarding commuting to school or university. However, in order to compare with previous years, such items were not registered in the present analyses.
For analytical purposes, six important variables were chosen: a) being active during leisure time (yes/no) - 150 minutes a week or more of moderate PA and/or 60 minutes a week or more of vigorous PA during leisure time; b) being active at work - positive report related to the question about lifting weight or taking long walks at work; c) being active at commuting (yes/no) - bicycling or walking to commute to work at least 30 minutes a day; d) being active at home (yes/no) - positive report of cleaning the household; e) physically inactive (yes/no) - individual characterized as inactive in all the previous variables; f) time spent in front of TV (sedentary lifestyle) (yes/no) - individual who reported watching TV for three or more hours a day in five days a week or more.
Data analysis considered the sample weight of VIGITEL. The main analyses compared the proportion of individuals classified in the category "yes" of the variables a-f. Afterwards, such analyses were separately repeated for men and women. Statistical significance of the variance in the period was assessed by the Poisson regression method, which considered the status of the participant in relation to the indicator (negative=0; positive=1) as a dependent variable, and the year of survey as a continuous variable. The evolution corresponding to a regression coefficient for the variable "year of survey" was significant and statistically different from zero (p<0.05).
VIGITEL was approved by the National Research Ethics Committee, protocol nº 13081/2008.
Results
Response rates at VIGITEL have been increasing since 2006, just as refusal percentages have been decreasing. The mean age of the participants has also slightly increased. The distribution of samples by gender and the total of participants in the country have remained the same throughout the years (Table 1).
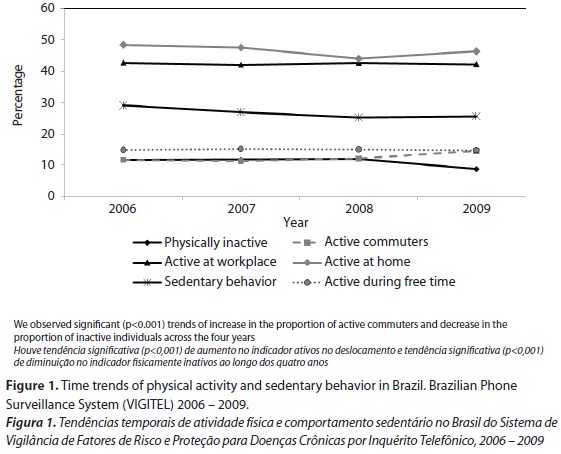
Figure 1 presents time trends of the main indicators regarding PA and time in front of the television for VIGITEL participants. The percentage of active people during leisure time and those who are active at home did not range much in the period, which characterizes a stable pattern of the indicators. The indicator "being active during leisure time" ranged only from 14.7% to 15.2% (p=0.36) in 4 years, which confirms that it is stable in the Brazilian population. The indicator "being active at home" ranged only from 44.1% to 48.5% throughout the 4 years, with no evidence of linear trend. The same behavior was observed as to the indicator "active at work" with values next to 42.5% for the whole period. The percentage of those who are active commuters presented a positive variation in the period, from 11.7 to 14.4% (p<0.001). As a consequence, the percentage of those who are physically inactive in relation to the 4 domains decreased in 2009 in comparison with the other years, from 11.7 (in 2006) to 8.7% (p<0.001). The habit of watching TV decreased from 29.2 to 25.8% in the period (p=0.01).
The patterns observed for the total sample were basically reproduced for men (Table 2) and women (Table 3). In comparison to men, women were less active during leisure time, at work and as commuters, and more active in the household. The sedentary lifestyle was similar both for men and women. At work, the difference was 64.7%, and as to commuting, it was 63.8%. However, concerning household chores, women were 302.3% more active than men. Such difference has an impact on the indicator "inactive", considering the 4 domains and generating a lower percentage of women who are inactive in comparison with men.
Discussion
PA levels in the Brazilian population were stable during leisure time and at household chores between 2006 and 2009, but they increased as to commuting and occupational activities, which results in the decreased percentage of inactive people in the country. The sedentary lifestyle, shown by the time spent in front of the television, presented a slight decrease in 2008 and 2009 when compared to 2006 and 2007.
Inside the country, our data can only be compared to two previous studies - one carried out in Pelotas, Rio Grande do Sul3, and another in the state of São Paulo4. In Pelotas, the percentage of individuals who reached 150 minutes a week considering all the four domains of PA decreased from 59% to 48% between 2002 and 2007 in a study that used a similar measuring method in both surveys (International Physical Activity Questionnaire), and comparable methodologies in both periods3. In the state of São Paulo, Matsudo et al4 reported a great increase in PA levels of the population between 2002 and 2008. Both previous studies used the short version of the International Physical Activity Questionnaire (IPAQ)7, which hinders the characterization of time trends by PA domains and results in comparisons that are only limited to PA estimates; thus, it is not possible to analyze any particular domain individually. Such limitation is surpassed by the time trend analysis in different domains, explored by the VIGITEL data assessed in this study.
Considering that nowadays almost 1,000 federated members are financed by the Ministry of Health8 for the development of PA promotion programs, besides other local programs which have functioned for a while, like Curitiba Ativa, Agita São Paulo, Academia da Cidade de Recife, Serviço de Orientação do Exercício4,8-10, the only natural time trend data regarding PA is available in Pelotas, a middle sized town to the south of the country, however, with no population intervention as to PA promotion.
Although the ability to generalize such data for the whole country is very limiting, the information from Pelotas suggested the PA levels have been decreasing with time, unlike what was observed in VIGITEL. However, the fact that VIGITEL data show the stabilization, or even increased PA levels (commuting), suggest a possible impact of the national health promotion programs. In fact, in the past few years the Ministry of Health has established the inclusion of indicators of increased PA levels with the cities. However, the complexity of the subject concerning PA, that includes changing behaviors and investing in the urban space to favor physical activity, that is, a combination of factors, besides the changes encouraged by the Ministry of Health, may explain the results in this study.
The increased PA related to commuting in the last year must be carefully analyzed due to the introduction of new questions in the questionnaire in 2009 regarding active commuting, besides a slight change in previous questions. However, considering the importance of this indicator for the improvement on the health status of the population, it can be established as an argument for local and national political decision making.
The combination of policies that propose public spaces directed to an active commuting is a positive trigger, and may be supported by VIGITEL. The urban planning, construction of bicycle paths, traffic safety and more organized transportation in the cities may meet the agenda of Health Promotion, in which physical activity and the traffic are connect in order to improve the quality of life in the cities and increase PA levels. In 2010, the World Health Day presented the subject Urban health (Matérias de Saúde Urbana), which brought up the discussion about PA, urban planning and safe traffic.
International literature concerning time trends of PA is practically exclusive of high income countries. To sum up, the findings show an important decrease of occupational PA levels11 and a slight increase in leisure time PA11,12 with time. Such data are different from those of VIGITEL, and there are many possible reasons for that. First of all, the decreased occupational PA levels reported in international studies occurred especially before 2000, whereas VIGITEL started in 2006. Thus, it is possible to believe that the decrease reported in literature might be true for Brazil, but it was not detected by VIGITEL because it happened before the beginning of this survey.
Leisure time PA has been stable in the United States for more than 20 years13,14, just like the findings in the Brazilian capitals. The period of 4 years of VIGITEL is probably too short to detect changes in this indicator, but it is a hypothesis to be tested in a few years. The difference between men and women in relation to leisure time PA observed in VIGITEL is in accordance with previous studies13,15.
The variable being active in the household causes an inversion in VIGITEL results according to gender, because women are three times more active in relation to this indicator than men. Thus, a trend of higher PA levels for men, which is observed in the other indicators, is inversed when the variable of household PA is included in the analysis. The interpretation of such variable is complex, since the evidence as to the benefits for the health of household PA is scarce. The indicator regarding work PA is also very simple. The slight increase in PA observed in the period must be carefully analyzed, because the effects of PA at the workplace depend on the type of professional activity, which, in many cases, may not be very safe, comfortable or provide ergonomic quality. Due to such aspects, household and work PA domains are the least accurate for decision making and to interpret the findings from an epidemiological point of view.
Some limitations of this study must be considered. First, VIGITEL variables as to occupational and household PA are very simple, and do not aim at quantifying the PA levels of these domains. Such decision was made because the existent instruments were incapable of quantifying PA practice regarding these domains16. Another limitation is the absence of data concerning cities in the country side.
The results presented in this article must be carefully analyzed because the short period of time that separates both surveys may not have been enough to produce statistically detectable time variations. That is, the statistical power of analysis, despite being elevated due to the sample size of the surveys, may not have been enough to detect real variations, but low magnitude ones. Therefore, the evolution trends of many indicators demonstrated by VIGITEL may be established with reliability only with the continuation of the system and with more information16.
To sum up, PA practice during free time (leisure) seems to be stable in the Brazilian capitals for the past years. Commuting PA has become more frequent and may be an essential indicator for the creation of public policies that involve the health sector and other departments. Leisure time PA indicators and the ones related to commuting are the most important as to population monitoring concerning health, because the results may be the target of multisectoral public policies. The continuous monitoring and strengthening of VIGITEL are seen as a priority, and the PA field is included in this process. At long term, there may be another time trend evaluation.
References
- 1. Knuth AG, Hallal PC. Temporal trends in physical activity: a systematic review. J Phys Act Health. 2009;6(5):548-59.
- 2. Hallal PC, Victora CG, Wells JC, Lima RC. Physical inactivity: prevalence and associated variables in Brazilian adults. Med Sci Sports Exerc. 20003;35(11):1894-900.
- 3. Knuth AG, Bacchieri G, Victora CG, Hallal PC. Changes in physical activity among Brazilian adults over a 5-year period. J Epidemiol Community Health. 2010;64(7):591-5.
- 4. Matsudo VK, Matsudo SM, Araujo TL, Andrade DR, Oliveira LC, Hallal PC. Time trends in physical activity in the state of São Paulo, Brazil: 2002-2008. Med Sci Sports Exerc. 2010;42(12):2231-6.
- 5. Florindo AA, Hallal PC, Moura EC, Malta DC. Práticas de atividade físicas e fatores associados em adulto, Brasil, 2006. Rev Saúde Pública. 2009;43 Suppl 2:65-73.
- 6. Brasil. VIGITEL Brasil 2008: Vigilância de fatores de risco e proteção para doenças crônicas por inquérito telefônico. Brasília: Ministério da Saúde, Secretaria de Vigilância em Saúde, Secretaria de Gestão Estratégica e Participativa;2009.
- 7. Craig CL, Marshall AL, Sjöström M, Bauman AE, Booth ML, Ainsworth BE, et al. International physical activity questionnaire: 12-country reliability and validity. Med Sci Sports Exerc. 2003;35(8):1381-95.
- 8. Knuth AG, Malta DC, Cruz DK, Castro AM, Fagundes J, Sardinha LM, et al. Description of the countrywide physical activity network coordinated by the Brazilian Ministry of Health: 2005-2008. J Phys Act Health. 2010;7 Suppl 2:S253-8.
- 9. Matsudo SM, Matsudo VR, Araujo TL, Andrade DR, Andrade EL, de Oliveira LC, et al. The Agita São Paulo Program as a model for using physical activity to promote health. Rev Panam Salud Publica. 2003;14(4):265-72.
- 10. Malta DC, AM C. Avanços e resultados na implementação da Política Nacional de Promoção da Saúde. Boletim Técnico do SENAC. 2009;35:63-71.
- 11. Stamatakis E, Ekelund U, Wareham NJ. Temporal trends in physical activity in England: the Health Survey for England 1991 to 2004. Prev Med. 2007; 45(6):416-23.
- 12. Barengo NC, Nissinen A, Tuomilehto J, Pekkarinen H. Twenty-five-year trends in physical activity of 30- to 59-year-old populations in eastern Finland. Med. Sci Sports Exerc. 2002;34(8):1302-7.
- 13. Brownson RC, Boehmer TK, Luke DA. Declining rates of physical activity in the United States: what are contributors? Annu Re. Public Health. 2005;26:421-43.
- 14. Centers for Disease Control and Prevention (CDC). Adult participation in recommended levels of physical activity - United States, 2001 and 2003. MMWR Morb Mortal Wkly Rep. 2005;54(47):1208-12.
- 15. Azevedo MR, Araujo CL, Reichert FF, Siqueira FV, da Silva MC, Hallal PC. Gender differences in leisure-time physical activity. Int J Public Health. 2007;52(1):8-15.
- 16. Hallal PC, Gomez LF, Parra DC, Lobelo F, Mosquera J, Florindo AA, et al. Lessons learned after 10 years of IPAQ use in Brazil and Colombia. J Phys Act Health. 2010;7 Suppl 2:S259-64.
Time trends of physical activity in Brazil (2006-2009)
Publication Dates
-
Publication in this collection
05 Oct 2011 -
Date of issue
Sept 2011
History
-
Reviewed
09 Feb 2011 -
Received
06 Jan 2011 -
Accepted
19 Feb 2011