
Abstract:
The objective of this work was to evaluate different traits of four corn (Zea mays) genotypes with contrasting responses to drought and to determine the main traits associated to such responses. The experiment was carried out in a greenhouse. The plants were grown in pots subjected to full irrigation. Drought was imposed to plants at 54 days after sowing and kept constant for 12 consecutive days; however, a group of plants remained under full irrigation. Traits related to leaf gas exchange, photochemical apparatus, growth, and yield were assessed, and data were subjected to hierarchical agglomerative clustering and principal component analysis. DKB 390 distinguishes from the other genotypes for growth and yield traits, while 2B-707 and DKB 390 discriminate from 'BRS 1030' and 'BRS 1010' for physiological traits. Ear length, kernel number per ear, above-ground dry matter, shoot dry matter, and plant height are the most important growth and yield traits to discriminate genotype-dependent drought tolerance. Among the physiological traits, the most important are: chlorophyll content, absorptivity, leaf temperature, maximum fluorescence in the dark-adapted state, minimum fluorescence in the dark-adapted state, water-use efficiency, and intercellular CO2 concentration.
Index terms:
Zea mays; abiotic stress; drought tolerance; water deficit
Resumo:
O objetivo deste trabalho foi avaliar diferentes características de quatro genótipos de milho (Zea mays) com respostas contrastantes à seca e determinar as principais características associadas a tais respostas. O experimento foi realizado em casa de vegetação. As plantas foram cultivadas em vasos submetidos à irrigação plena. A seca foi imposta às plantas aos 54 dias após a semeadura e mantida constante por 12 dias consecutivos; no entanto, um grupo de plantas permaneceu sob irrigação plena. Avaliaram-se as características relacionadas às trocas gasosas foliares, ao aparato fotoquímico, ao crescimento e à produção. Os dados foram submetidos a agrupamento hierárquico e análise de componentes principais. DKB 390 distingue-se dos demais genótipos quanto às características de crescimento e produção, enquanto 2B-707 e DKB 390 distinguem-se dos genótipos 'BRS 1030' e 'BRS 1010' quanto às características fisiológicas. O comprimento da espiga, o número de grãos por espiga, a matéria seca da parte aérea e do caule e a altura de planta são as características de crescimento e produção mais importantes para discriminar os genótipos de milho quanto à tolerância à seca. Entre as características fisiológicas, as mais importantes são: conteúdo de clorofila, absortividade, temperatura da folha, fluorescência máxima no escuro, fluorescência mínima no escuro, eficiência no uso de água e concentração intercelular de CO2.
Termos para indexação:
Zea mays; estresse abiótico; tolerância à seca; deficit hídrico
Introduction
Drought tolerance in plants is a complex phenomenon, which is strongly influenced by morphological, physiological, and biochemical traits, as well as by environmental factors and their interactions (Farooq et al., 2009FAROOQ, M.; WAHID, A.; KOBAYASHI, N.; FUJITA, D.; BASRA, S.M.A. Plant drought stress: effects, mechanisms and management. Agronomy for Sustainable Development, v.29, p.185-212, 2009. DOI: https://doi.org/10.1051/agro:2008021.
https://doi.org/10.1051/agro:2008021...
; Jaleel et al., 2009JALEEL, C.A.; MANIVANNAN, P.; WAHID, A.; FAROOQ, M.; AL-JUBURI, H.J.; SOMASUNDARAM, R.; PANNEERSELVAM, R. Drought stress in plants: a review on morphological characteristics and pigments composition. International Journal of Agriculture and Biology, v.11, p.100-105, 2009.; Obidiegwu et al., 2015OBIDIEGWU, J.E.; BRYAN, G.J.; JONES, H.G.; PRASHAR, A. Coping with drought: stress and adaptive responses in potato and perspectives for improvement. Frontiers in Plant Science, v.6, art.542, 2015. DOI: https://doi.org/10.3389/fpls.2015.00542.
https://doi.org/10.3389/fpls.2015.00542...
; Khan et al., 2018KHAN, A.; PAN, X.; NAJEEB, U.; TAN, D.K.Y.; FAHAD, S.; ZAHOOR, R.; LUO, H. Coping with drought: stress and adaptive mechanisms, and management through cultural and molecular alternatives in cotton as vital constituents for plant stress resilience and fitness. Biological Research, v.51, art.47, 2018. DOI: https://doi.org/10.1186/s40659-018-0198-z.
https://doi.org/10.1186/s40659-018-0198-...
; Sahebi et al., 2018SAHEBI, M.; HANAFI, M.M.; RAFII, M.Y.; MAHMUD, T.M.M; AZIZI, P.; OSMAN, M.; ABIRI, R.; TAHERI, S.; KALHORI, N.; SHABANIMOFRAD, M.; MIAH, G.; ATABAKI, N. Improvement of drought tolerance in rice (Oryza sativa L.): genetics, genomic tools, and the WRKY gene family. BioMed Research International, v.2018, art.3158474, 2018. DOI: https://doi.org/10.1155/2018/3158474.
https://doi.org/10.1155/2018/3158474...
). Drought stress can reach the plant at any stage of the cycle. Because of this fact, a specific trait may be more important than others for plants to better resist stress (Tardieu, 2012TARDIEU, F. Any trait or trait-related allele can confer drought tolerance: just design the right drought scenario. Journal of Experimental Botany, v.63, p.25-31, 2012. DOI: https://doi.org/10.1093/jxb/err269.
https://doi.org/10.1093/jxb/err269...
). Consequently, several secondary traits, known as physiological traits (Silva et al., 2007SILVA, M. de A.; JIFON, J.L.; SILVA, J.A.G. da; SHARMA, V. Use of physiological parameters as fast tools to screen for drought tolerance in sugarcane. Brazilian Journal of Plant Physiology, v.19, p.193-201, 2007. DOI: https://doi.org/10.1590/S1677-04202007000300003.
https://doi.org/10.1590/S1677-0420200700...
; Masuka et al., 2012MASUKA, B.; ARAUS, J.L.; DAS, B.; SONDER, K.; CAIRNS, J.E. Phenotyping for abiotic stress tolerance in maize. Journal of Integrative Plant Biology, v.54, p.238-249, 2012. DOI: https://doi.org/10.1111/j.1744-7909.2012.01118.x.
https://doi.org/10.1111/j.1744-7909.2012...
), have been used to select drought-tolerant plants. Most uses of these traits showed little, or no success, in breeding programs, for which the most important trait is yield (Obidiegwu et al., 2015OBIDIEGWU, J.E.; BRYAN, G.J.; JONES, H.G.; PRASHAR, A. Coping with drought: stress and adaptive responses in potato and perspectives for improvement. Frontiers in Plant Science, v.6, art.542, 2015. DOI: https://doi.org/10.3389/fpls.2015.00542.
https://doi.org/10.3389/fpls.2015.00542...
; Sahebi et al., 2018SAHEBI, M.; HANAFI, M.M.; RAFII, M.Y.; MAHMUD, T.M.M; AZIZI, P.; OSMAN, M.; ABIRI, R.; TAHERI, S.; KALHORI, N.; SHABANIMOFRAD, M.; MIAH, G.; ATABAKI, N. Improvement of drought tolerance in rice (Oryza sativa L.): genetics, genomic tools, and the WRKY gene family. BioMed Research International, v.2018, art.3158474, 2018. DOI: https://doi.org/10.1155/2018/3158474.
https://doi.org/10.1155/2018/3158474...
). The main reason for the failure can be attributed to the complexity of drought stress, as there is not a universal trait that works for all drought situations at any stage of the plant (Tardieu, 2012TARDIEU, F. Any trait or trait-related allele can confer drought tolerance: just design the right drought scenario. Journal of Experimental Botany, v.63, p.25-31, 2012. DOI: https://doi.org/10.1093/jxb/err269.
https://doi.org/10.1093/jxb/err269...
). According to Masuka et al (2012)MASUKA, B.; ARAUS, J.L.; DAS, B.; SONDER, K.; CAIRNS, J.E. Phenotyping for abiotic stress tolerance in maize. Journal of Integrative Plant Biology, v.54, p.238-249, 2012. DOI: https://doi.org/10.1111/j.1744-7909.2012.01118.x.
https://doi.org/10.1111/j.1744-7909.2012...
, different traits will confer tolerance to different types of drought stress, considering timing, frequency, and intensity of drought. Furthermore, tolerance to vegetative drought stress does not necessarily confer tolerance in the reproductive stage.
Advances in drought tolerance have been achieved most of the time without the aid of plant physiology tools; and the rates of gain in drought tolerance have resulted from conventional selection in a large hybrid development program that relies on extensive multi-environment testing (MET) to identify superior progenies (Campos et al., 2004CAMPOS, H.; COOPER, M.; HABBEN, J.E.; EDMEADES, G.O.; SCHUSSLER, J.R. Improving drought tolerance in maize: a view from industry. Field Crops Research, v.90, p.19-34, 2004. DOI: https://doi.org/10.1016/j.fcr.2004.07.003.
https://doi.org/10.1016/j.fcr.2004.07.00...
). Usually, in these programs, only grain yield is evaluated. It is, therefore, an expensive, laborious, and time-consuming phenotyping method. Advances in breeding are frequently hindered by methodological bottlenecks (Araus et al., 2012ARAUS, J.L.; SERRET, M.D.; EDMEADES, G.O. Phenotyping maize for adaptation to drought. Frontiers in Physiology, v.3, art.305, 2012. DOI: https://doi.org/10.3389/fphys.2012.00305.
https://doi.org/10.3389/fphys.2012.00305...
). Among these, proper phenotyping is perhaps one of the most obvious.
There are several physiological traits that are used for the assessment of drought tolerance in corn (Araus et al., 2012ARAUS, J.L.; SERRET, M.D.; EDMEADES, G.O. Phenotyping maize for adaptation to drought. Frontiers in Physiology, v.3, art.305, 2012. DOI: https://doi.org/10.3389/fphys.2012.00305.
https://doi.org/10.3389/fphys.2012.00305...
). The most evaluated traits have been those derived from gas exchange techniques, especially water-use efficiency (Masuka et al., 2012MASUKA, B.; ARAUS, J.L.; DAS, B.; SONDER, K.; CAIRNS, J.E. Phenotyping for abiotic stress tolerance in maize. Journal of Integrative Plant Biology, v.54, p.238-249, 2012. DOI: https://doi.org/10.1111/j.1744-7909.2012.01118.x.
https://doi.org/10.1111/j.1744-7909.2012...
). This trait has been used for the evident relationship between the assimilation of CO2 and the use of water, and for its ease of measuring and interpretation. However, there are other traits that need to be explored, which are more complex and integrative. The performance of corn germplasm for stress-tolerant traits may be best analyzed by effective screening, to discriminate between drought-tolerant and drought-susceptible genotypes by easily measured and evaluated traits (Badr et al., 2020BADR, A.; EL-SHAZLY, H.H.; TARAWNEH, R.A.; BÖRNER, A. Screening for drought tolerance in maize (Zea mays L.) germplasm using germination and seedling traits under simulated drought conditions. Plants, v.9, art.565, 2020. DOI: https://doi.org/10.3390/plants9050565.
https://doi.org/10.3390/plants9050565...
).
In addition to the gas exchange techniques previously mentioned, it is possible to discriminate the contrasting responses of corn genotypes to drought based on chlorophyll fluorescence (Sousa et al., 2017SOUSA, C.A.F. de; PAIVA, D.S. de; CASARI, R.A. das C.N.; OLIVEIRA, N.G. de; MOLINARI, H.B.C.; KOBAYASHI, A.K.; MAGALHÃES, P.C.; GOMIDE, R.L.; SOUSA JR., M.T. A procedure for maize genotypes discrimination to drought by chlorophyll fluorescence imaging rapid light curves. Plant Methods, v.13, art.61, 2017. DOI: https://doi.org/10.1186/s13007-017-0209-z.
https://doi.org/10.1186/s13007-017-0209-...
) and thermography (Casari et al., 2019CASARI, R.A.C.N.; PAIVA, D.S.; SILVA, V.N.B.; FERREIRA, T.M.M.; SOUSA JUNIOR, M.T.; OLIVEIRA, N.G.; KOBAYASHI, A.K.; MOLINARI, H.B.C.; SANTOS, T.T.; GOMIDE, R.L.; MAGALHÃES, P.C.; SOUSA, C.A.F. Using thermography to confirm genotypic variation for drought response in maize. International Journal of Molecular Sciences, v.20, art. 2273, 2019. DOI: https://doi.org/10.3390/ijms20092273.
https://doi.org/10.3390/ijms20092273...
). However, even using these refined techniques, it is necessary to define which traits are responsible for discrimination, in order to make the process more effective and reliable.
The objective of this work was to evaluate different traits of four corn genotypes with contrasting responses to drought, and to determine the main traits associated to such responses.
Materials and Methods
The experiment was carried out in a greenhouse, at the Embrapa Agroenergia, in Brasília (15.732°S, 47.900°W), DF, Brazil, from December 8, 2016 (sowing) to May 2, 2017 (harvesting). The temperature fluctuated according to the environment, and it was monitored and recorded during the experiment (Figure 1).
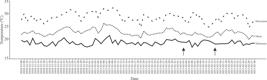
Daily air temperature collected from a weather station close to the experimental site. The two arrows indicate the beginning and the end of drought.
Four corn genotypes with different levels of responses to drought were used, which had previously been screened based on grain yield in the target environment, in a five-year series of field experiments carried out by Embrapa Milho e Sorgo in the municipalities of Janaúba, Petrolina, and Teresina, in the states of Minas Gerais, Pernambuco, and Piauí, Brazil. In the field, the genotypes 2B 707 and DKB 390 genotypes were tolerant, 'BRS 1030' was classified as intermediate, and 'BRS 1010' was sensitive to drought (Souza et al., 2013SOUZA, T.C. de; CASTRO, E.M. de; MAGALHÃES, P.C.; LINO, L. de O.; ALVES, E.T.; ALBUQUERQUE, P.E.P. de. Morphophysiology, morphoanatomy, and grain yield under field conditions for two maize hybrids with contrasting response to drought stress. Acta Physiologiae Plantarum, v.35, p.3201-3211, 2013. DOI: https://doi.org/10.1007/s11738-013-1355-1.
https://doi.org/10.1007/s11738-013-1355-...
; Avila et al., 2016AVILA, R.G.; MAGALHÃES, P.C.; ALVARENGA, A.A. de; LAVINSKI, A. de O.; CAMPOS, C.N.; SOUZA, T.C. de; GOMES JÚNIOR, C.C. Drought-tolerant maize genotypes invest in root system and maintain high harvest index during water stress. Revista Brasileira de Milho e Sorgo, v.15, p.451-461, 2016. DOI: https://doi.org/10.18512/1980-6477/rbms.v15n3p450-460.
https://doi.org/10.18512/1980-6477/rbms....
; Souza et al., 2016SOUZA, T.C. de; MAGALHÃES, P.C.; CASTRO, E.M. de; DUARTE, V.P.; LAVINSKY, A.O. Corn root morphoanatomy at different development stages and yield under water stress. Pesquisa Agropecuária Brasileira, v.51, p.330-339, 2016. DOI: https://doi.org/10.1590/S0100-204X2016000400005.
https://doi.org/10.1590/S0100-204X201600...
). Seeds were sown in pots (top diameter, 40 cm; height, 40 cm; bottom diameter, 32 cm) filled (20 kg) with soil. The soil was classified as Latossolo Vermelho distrófico (Santos et al., 2018SANTOS, H.G. dos; JACOMINE, P.K.T; ANJOS, L.H.C. dos; OLIVEIRA, V.A. de; LUMBRERAS, J.F.; COELHO, M.R.; ALMEIDA, J.A. de; ARAUJO FILHO, J.C. de; OLIVEIRA, J.B. de; CUNHA, T.J.F. Brazilian soil classification system. 5th ed. rev. and exp. Brasília: Embrapa, 2018. E-book.), which corresponds to Red Ferralsol (IUSS Working Group WRB, 2015IUSS WORKING GROUP WRB. World Reference Base for Soil Resources 2014: international soil classification system for naming soils and creating legends for soil maps: update 2015. Rome: FAO, 2015. (FAO. World Soil Resources Reports, 106). ). Based on soil physicochemical analyses, lime and fertilizers were added at 4 Mg ha-1 limestone, in addition to 200 kg ha-1 N, 400 kg ha-1 P2O5, and 200 kg ha-1 K2O. Two corn plants were grown per pot, on a daily replenishment of water at field capacity level (100% of available water).
Water supply was withheld for drought-stressed plants at 54 days after sowing. At this time, they had reached the V12 growth stage (12th leaf collar visible). The plants were considered stressed when gas exchange rates approached zero. From this moment on, the water supply was managed to maintain a constant drought stress level for 12 consecutive days. From that time on, they were re-irrigated at the field capacity until the end of the cycle. A group of plants remained at field capacity during all the cycle (control). A completely randomized design was used with five replicates.
Soil water content (SWC) was measured based on the gravimetric method (Bittelli, 2011BITTELLI, M. Measuring soil water content: a review. HortTechnology, v.21, p.293-300, 2011. DOI: https://doi.org/10.21273/HORTTECH.21.3.293.
https://doi.org/10.21273/HORTTECH.21.3.2...
). The soil samples were oven dried at 105°C until a constant weight was achieved. The daily water consumption (DWC) by evapotranspiration and the remaining soil water levels (SWL) were recorded for both control and drought-stressed plants. The amount of water lost was daily replenished to return to the water levels according to the treatment to which the plants were subjected.
The methodology used for leaf relative water content (RWC) was described by Casari et al. (2019)CASARI, R.A.C.N.; PAIVA, D.S.; SILVA, V.N.B.; FERREIRA, T.M.M.; SOUSA JUNIOR, M.T.; OLIVEIRA, N.G.; KOBAYASHI, A.K.; MOLINARI, H.B.C.; SANTOS, T.T.; GOMIDE, R.L.; MAGALHÃES, P.C.; SOUSA, C.A.F. Using thermography to confirm genotypic variation for drought response in maize. International Journal of Molecular Sciences, v.20, art. 2273, 2019. DOI: https://doi.org/10.3390/ijms20092273.
https://doi.org/10.3390/ijms20092273...
. Gas exchange measurements were carried out on the middle third of the healthy and fully expanded leaf 12, in a previously marked area. An infrared gas analyzer model 6400XT (Li-Cor Biosciences, Nebraska, USA), equipped with a size measuring head with 2×3 cm and an artificial LED lighting system model 6400-02B, was used (Sousa et al., 2017SOUSA, C.A.F. de; PAIVA, D.S. de; CASARI, R.A. das C.N.; OLIVEIRA, N.G. de; MOLINARI, H.B.C.; KOBAYASHI, A.K.; MAGALHÃES, P.C.; GOMIDE, R.L.; SOUSA JR., M.T. A procedure for maize genotypes discrimination to drought by chlorophyll fluorescence imaging rapid light curves. Plant Methods, v.13, art.61, 2017. DOI: https://doi.org/10.1186/s13007-017-0209-z.
https://doi.org/10.1186/s13007-017-0209-...
). It was set up to hold 50-60% relative humidity and 2000 μmol m-2 s-1 light intensity in the measuring head, 30°C block temperature, and 500 μmol s-1 flow rate at. The concentration of CO2 in the reference cell was controlled at 400 ppm using a CO2 mixer 6400-01 (Li-Cor Biosciences, Nebraska, USA).
The following gas exchange variables were evaluated: net CO2 assimilation rate (Photo), conductance to water vapor (Cond), transpiration rate (Trmmol), intercellular CO2 concentration (Ci), vapor pressure deficit based on leaf temperature (VpdL), leaf temperature (CTleaf), total conductance to water vapor (CndTotal), vapor pressure deficit based on air temperature (VpdA), total conductance to CO2 (CondCO2), intercellular CO2/ambient CO2 ratio (Ci/Ca), apparent carboxylation efficiency (ACE). They were calculated based on equations described in the Li-Cor 6400XT user manual (Li-Cor Biosciences, Inc., 2011LI-COR BIOSCIENCES, INC. Using the LI-6400 / LI-6400XT. version 6. Lincoln, 2011. Available at: <Available at: https://www.licor.com/documents/s8zyqu2vwndny903qutg >. Accessed on: Dec. 5 2020.
https://www.licor.com/documents/s8zyqu2v...
). A measurement of transpiration efficiency in leaves was determined as water-use efficiency (WUE), which was calculated as the ratio of instantaneous net CO2 assimilation (Photo) to transpiration (Trmmol) = A/E (Vadez et al., 2014VADEZ, V.; KHOLOVA, J.; MEDINA, S.; KAKKERA, A.; ANDERBERG, H. Transpiration efficiency: new insights into an old story. Journal of Experimental Botany, v.65, p.6141-6153, 2014. DOI: https://doi.org/10.1093/jxb/eru040.
https://doi.org/10.1093/jxb/eru040...
).
The chlorophyll content measures (CCM) were performed on leaf 12, in the same portion used for gas exchange and chlorophyll fluorescence measurements, as described by Sousa et al. (2017)SOUSA, C.A.F. de; PAIVA, D.S. de; CASARI, R.A. das C.N.; OLIVEIRA, N.G. de; MOLINARI, H.B.C.; KOBAYASHI, A.K.; MAGALHÃES, P.C.; GOMIDE, R.L.; SOUSA JR., M.T. A procedure for maize genotypes discrimination to drought by chlorophyll fluorescence imaging rapid light curves. Plant Methods, v.13, art.61, 2017. DOI: https://doi.org/10.1186/s13007-017-0209-z.
https://doi.org/10.1186/s13007-017-0209-...
.
For chlorophyll fluorescence measurements, the corn plants were analyzed by means of the chlorophyll fluorescence technique as described by Sousa et al. (2017)SOUSA, C.A.F. de; PAIVA, D.S. de; CASARI, R.A. das C.N.; OLIVEIRA, N.G. de; MOLINARI, H.B.C.; KOBAYASHI, A.K.; MAGALHÃES, P.C.; GOMIDE, R.L.; SOUSA JR., M.T. A procedure for maize genotypes discrimination to drought by chlorophyll fluorescence imaging rapid light curves. Plant Methods, v.13, art.61, 2017. DOI: https://doi.org/10.1186/s13007-017-0209-z.
https://doi.org/10.1186/s13007-017-0209-...
. The following chlorophyll fluorescence parameters were assessed: ETR, electron transport rate; F, fluorescence yield; Fm, maximal fluorescence yield (dark-acclimated samples); Fm’, maximal fluorescence yield (light-acclimated samples); Fo, minimal fluorescence yield in dark-acclimated samples; Fo’, minimal fluorescence yield in light-acclimated samples; Fs, steady-state fluorescence; Fv/Fm, maximal PSII quantum yield; NPQ, nonphotochemical quenching; qL, coefficient of photochemical quenching (lake model); qN, coefficient of nonphotochemical quenching; qP, coefficient of photochemical quenching (puddle model); Y(II), effective PSII quantum yield; Y(NO), quantum yield of nonregulated energy dissipation; Y(NPQ), quantum yield of regulated energy dissipation.
Plant height and number of leaves per plant were determined at the end of the growing season. Whole plants were harvested at the end of the cycle. Harvested ears had their length and diameter measured, then, they were separated into their component parts: straw, cob, and grains. The number of ears per plant, the number of kernels per ear, and the weight of one hundred grains were determined. Then, the remainder of the plant aerial parts (that is, culms and leaves) were weighed. Freshly harvested aerial parts and grains were dried in forced-air oven at 70°C for 72 hours, and 105°C for 24 hours, respectively. All these variables were expressed on a dry matter basis. The harvest index was calculated as the ratio between grain yield and above-ground dry matter multiplied by 100.
Hierarchical agglomerative clustering of correlation matrix (Hastie et al., 2008HASTIE, T.; TIBSHIRANI, R.; FRIEDMAN, J.H. The elements of statistical learning: data mining, inference and prediction. 2nd ed. New York: Springer, 2008. 745p.) to cluster variables exhibiting similar correlation patterns was performed. The linkage method used was average, with the Euclidean distance. The correlation matrix was produced using the Pearson’s correlation, which tests the strength and direction of linear relationships between pairs of continuous variables. The Pearson’s correlation coefficient (r) was interpreted according to Mukaka (2012)MUKAKA, M.M. Statistics corner: a guide to appropriate use of correlation coefficient in medical research. Malawi Medical Journal, v.24, p.69-71, 2012. DOI: https://doi.org/10.4314/MMJ.V24I3.
https://doi.org/10.4314/MMJ.V24I3...
. Thus, r equals to 0.00-0.30 means a negligible correlation, while 0.30-0.50, 0.50-0.70, 0.70-0.90, and 0.90-1.00 means, respectively, a low, moderate, high, and very high uphill or positive linear relationship. The interpretation for these same r values, but with a negative sign, follows the same logic; the difference is that the linear correlation is negative or downhill.
The physiological variables and the growth and yield ones were subjected to principal component analysis (Hastie et al., 2008HASTIE, T.; TIBSHIRANI, R.; FRIEDMAN, J.H. The elements of statistical learning: data mining, inference and prediction. 2nd ed. New York: Springer, 2008. 745p.) to discriminate corn genotypes subjected to drought. The median of the variables during the stress period (3rd to 14th day of the experiment) was used. For this, initially, the raw data were normalized (translation to mean, scale to variance 1). Then, after transformation to the main components, loading and score plots were generated. The loading plot shows the influence of measurements on the two main components. Finally, the score plot shows the breakdown of genotypes and treatments based on the two main components. For the growth and production variables, the average of treatments was used.
The most important variables for discrimination of corn genotypes under drought were found according to the analysis suggested by Chen et al. (2014)CHEN, D.; NEUMANN, K.; FRIEDEL, S.; KILIAN, B.; CHEN, M.; ALTMANN, T.; KLUKAS, C. Dissecting the phenotypic components of crop plant growth and drought responses based on high-throughput image analysis. Plant Cell, v.26, p.4636-4655, 2014. DOI: https://doi.org/10.1105/tpc.114.129601.
https://doi.org/10.1105/tpc.114.129601...
. Before subjecting the data to analysis, the Grubb test for outlier detection was applied (Chen et al., 2014CHEN, D.; NEUMANN, K.; FRIEDEL, S.; KILIAN, B.; CHEN, M.; ALTMANN, T.; KLUKAS, C. Dissecting the phenotypic components of crop plant growth and drought responses based on high-throughput image analysis. Plant Cell, v.26, p.4636-4655, 2014. DOI: https://doi.org/10.1105/tpc.114.129601.
https://doi.org/10.1105/tpc.114.129601...
). To this purpose, the samples were grouped in groups of 5 (same day, treatment, genotype, and variable). The detected outliers were replaced by 1% or 99% percentile, if the outlier was below or above the inliers, respectively. Subsequently, the samples were standardized, that is, they were subjected to procedures that placed them on the same value scale. The standardization process subtracted from each observation the mean of the variable (shift) and divided it by the standard deviation (scale), which resulted in distributions with zero mean and unit standard deviation. The variables were selected using the variance inflation factors - VIFs (Chen et al., 2014CHEN, D.; NEUMANN, K.; FRIEDEL, S.; KILIAN, B.; CHEN, M.; ALTMANN, T.; KLUKAS, C. Dissecting the phenotypic components of crop plant growth and drought responses based on high-throughput image analysis. Plant Cell, v.26, p.4636-4655, 2014. DOI: https://doi.org/10.1105/tpc.114.129601.
https://doi.org/10.1105/tpc.114.129601...
). In an interactive process, variables with high correlation with the others were removed. The procedure was implemented by adopting the VIF threshold > 5.
Results and Discussion
In order to simplify the cluster analysis of physiological traits, only the two major clusters formed under both control (Figure 2 A) and drought (Figure 2 B) were taken into account. Regardless of the water regime, the physiological traits were grouped in a similar way. In general, the traits related to fluorescence emission and heat generation were part of one cluster, while those related to electron flow in the Z-scheme of photosynthesis and gas exchange were part of another cluster. Such results indicate that the formation of clusters followed the way the plants dealt with the absorbed light. Thus, the traits related to the dissipation of light energy by nonphotochemical processes were in a cluster, and those traits related to the use of light energy for photosynthesis were in other cluster. Therefore, two predominantly different and competitive processes were involved for the clustering of physiological traits (Sousa et al., 2017SOUSA, C.A.F. de; PAIVA, D.S. de; CASARI, R.A. das C.N.; OLIVEIRA, N.G. de; MOLINARI, H.B.C.; KOBAYASHI, A.K.; MAGALHÃES, P.C.; GOMIDE, R.L.; SOUSA JR., M.T. A procedure for maize genotypes discrimination to drought by chlorophyll fluorescence imaging rapid light curves. Plant Methods, v.13, art.61, 2017. DOI: https://doi.org/10.1186/s13007-017-0209-z.
https://doi.org/10.1186/s13007-017-0209-...
).

Clustering and correlations among physiological variables measured in corn (Zea mays) leaves whose plants were grown under the control (A) or drought treatment (B). Correlations were obtained from the medians of the variables evaluated for 12 consecutive days (between the 3rd and 14th day after treatment initiation). The bar on the left and above the figure indicates the strength of correlations among variables. A) Evapotranspirated water was replenished daily to the soil to reach the field capacity; B) the plants were subjected to water deficit stress, at the pre-flowering stage, for 12 consecutive days. Abbreviations: Photo, net CO2 assimilation rate; Cond, conductance to water vapor; Trmmol, transpiration rate; Ci, intercellular CO2 concentration; VpdL, vapor pressure deficit based on leaf temp; CTleaf, leaf temperature; CndTotal, total conductance to water vapor; VpdA, vapor pressure deficit based on air temperature; CondCO2, total conductance to CO2; Ci/Ca, intercellular CO2/ambient CO2 ratio; ACE, apparent carboxylation efficiency; WUE, water-use efficiency; CCM, chlorophyll content measure; Abs., measurement of absorption light by the leaf; NPQ, nonphotochemical quenching; qN, coefficient of nonphotochemical quenching in the lake model; Fo, Fo’, minimum fluorescence yield on dark- and light-adapted leaf, respectively; WatCons, water consumption; Y(NO), quantum yield of nonregulated energy dissipation; F, fluorescence yield before application of a saturate pulse; Fm, Fm’, maximum fluorescence yield on dark- and light-adapted leaf, respectively; Y(NPQ), quantum yield of regulated energy dissipation; Fv/Fm maximum PSII quantum yield; RWC, relative water content; WatCons, water consumption; SML, soil moisture level; ETR, electron transport rate; qL, coefficient of photochemical quenching in the lake model; Y(II), effective PSII quantum yield; qP, coefficient of photochemical quenching in the puddle model.
Significant correlations occurred within and between clusters. The correlations within cluster were generally positive, with some exceptions. As expected, strong correlations were obtained between gas exchange variables and those related to the photochemical apparatus. This occurred because such variables act in a complementary way in the photosynthetic process. The correlations between clusters were generally negative because the variables act opposite to each other. However, the most important information to be extracted from these results is that the drought has increased the strength of correlations within and between clusters. Thus, in the control (Figure 2 A), there were 14 variables with values of r ≥ 0.5, while in the treatment subjected to drought (Figure 2 B), this number has increased to 20. Taken together, the data show that the corn plants had a high phenotypic variability in the control treatment, which can be inferred from the wide range of values of the traits (Figure 2 A). In the treatment subjected to drought, the traits moved toward correlated critical values. According to Chen et al. (2014)CHEN, D.; NEUMANN, K.; FRIEDEL, S.; KILIAN, B.; CHEN, M.; ALTMANN, T.; KLUKAS, C. Dissecting the phenotypic components of crop plant growth and drought responses based on high-throughput image analysis. Plant Cell, v.26, p.4636-4655, 2014. DOI: https://doi.org/10.1105/tpc.114.129601.
https://doi.org/10.1105/tpc.114.129601...
, it is an evidence that, under stress, plants exhibit less phenotypic variability than controls. It also means that the corn genotypes under study underwent the same damages caused by drought and activated similar mechanisms to deal with water stress. Thus, the variables reached extreme values and, therefore, with less variability.
Drought caused changes in the pattern of correlation in the growth and yield traits of corn plants (Figure 3). Most correlations were obvious in both water regimes. However, the inversion of the correlation is noteworthy among some specific traits caused by drought. For instance, the correlation between grain yield and number of leaves or shoot biomass was positive in the control (Figure 3 A), but negative in the treatment subjected to drought (Figure 3 B). It seems that corn plants have directed resources to grain yield, as indicated by the perfect correlation between photoassimilates partitioning, represented by the harvest index, and grain yield. One of the changes caused by drought in crop plants occurs in the pattern of assimilates partitioning into reproductive organs, which decreases as water deficit intensifies (Shareef et al., 2018SHAREEF, M.; GUI, D.; ZENG, F.; AHMED, Z.; WAGAS, M.; ZHANG, B.; IQBAL, H.; FIAZ, M. Impact of drought on assimilates partitioning associated fruiting physiognomies and yield quality attributes of desert grown cotton. Acta Physiologiae Plantarum, v.40, art.71, 2018. DOI: https://doi.org/10.1007/s11738-018-2646-3.
https://doi.org/10.1007/s11738-018-2646-...
). When stress by water deficit is applied to corn plants in the pre-flowering stage, they practically reached their maximum size; in such case, grain yield may be mainly affected by the change in the partitioning of photoassimilates (Edmeades et al., 1999EDMEADES, G.O.; BOLAÑOS, J.; CHAPMAN, S.C.; LAFITTE, H.R.; BÄNZIGER, M. Selection improves drought tolerance in tropical maize populations: I. Gains in biomass, grain yield, and harvest index. Crop Science, v.39, p.1306-1315, 1999. DOI: https://doi.org/10.2135/cropsci1999.3951306x.
https://doi.org/10.2135/cropsci1999.3951...
).
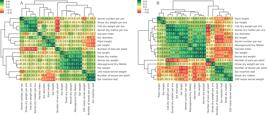
Clustering and correlations among growth and yield variables in corn (Zea mays) plants grown under control (A) or drought treatments (B). Correlations were obtained from the medians of the variables. The bar on the left and above the figure indicates the strength of correlations. A) Evapotranspirated water was replenished daily to the soil to reach the field capacity; B) the plants were subjected to water deficit stress, at the pre-flowering stage, for 12 consecutive days, and then re-watered normally until the end of the cycle.
For future initiatives in high-throughput phenotyping, it is important to note that, under drought, the kernel dry weight correlates with image-estimable variables, such as above-ground dry matter, ear length, and plant height.
In the cluster analysis, the growth and yield traits were not able to discriminate the treatments (control or drought), but partially discriminated the corn genotypes under study (Figure 4). Thus, under water stress, 'BRS 1030', 'BRS 1010', and 2B-707 genotypes showed similar biometric patterns. Under drought, except for a probable outlier, DKB-390 assumed a different pattern from the other genotypes, showing characteristics closer to the controls than to the drought plants.

Clustering of control (blue) and drought (yellow) treatments, and corn (Zea mays) genotypes, based on growth and yield variables. The plants were supplied daily with water for soil to reach the field capacity throughout the cycle (control) or they were subjected to water stress at the pre-flowering stage, for 12 consecutive days, and then re-watered until the end of the cycle (drought). Blue bars indicate control plants and yellow bars indicate plants under stress. The top left color bar indicates the value of each variable on a scale from -3 to +1.5.
The physiological traits clearly discriminated the treatments and the drought-tolerant corn genotypes, with a probable outlier for each one (Figure 5). These results indicate that all physiological traits were affected by drought to a greater or lesser extent, and such changes were genotype-dependent.
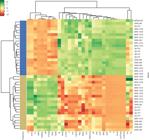
Clustering of control (blue) and drought (yellow) treatments, and corn (Zea mays) genotypes based on physiological variables. The plants were supplied daily with water for the soil to reach the field capacity throughout the cycle (control), or they were subjected to water deficit stress at the pre-flowering stage for 12 consecutive days (drought). The data used correspond to the mean of the variables on the 12th day of stress. Blue bars indicate control plants and yellow bars indicate drought stressed plants. The top left color bar indicates the value of each variable, on a scale from -2 to +2. The abbreviations are the same as in Figure 2.
Growth and yield traits did not discriminate the treatments (Figure 4) probably because they underwent moderate effects of drought, especially the former traits. It should be taken into account that the water deficit was applied to plants at the pre-flowering stage, which corresponds to the end of the vegetative growth stage (Abendroth et al., 2011ABENDROTH, L.J.; ELMORE, R.W.; BOYER, M.J.; MARLAY, S.K. Corn growth and development. Ames: Iowa State University, 2011. Available at: <Available at: https://store.extension.iastate.edu/Product/Corn-Growth-and-Development >. Accessed on: Jan. 10 2020.
https://store.extension.iastate.edu/Prod...
). Even so, those traits were able to group the DKB 390 genotype and separate it from the others. It means that this genotype had different growth and yield characteristics from the others, regardless of the treatment. In fact, DKB 390 has been characterized as a drought-tolerant genotype in both greenhouse and field experiments (Souza et al., 2013SOUZA, T.C. de; CASTRO, E.M. de; MAGALHÃES, P.C.; LINO, L. de O.; ALVES, E.T.; ALBUQUERQUE, P.E.P. de. Morphophysiology, morphoanatomy, and grain yield under field conditions for two maize hybrids with contrasting response to drought stress. Acta Physiologiae Plantarum, v.35, p.3201-3211, 2013. DOI: https://doi.org/10.1007/s11738-013-1355-1.
https://doi.org/10.1007/s11738-013-1355-...
; Avila et al., 2016AVILA, R.G.; MAGALHÃES, P.C.; ALVARENGA, A.A. de; LAVINSKI, A. de O.; CAMPOS, C.N.; SOUZA, T.C. de; GOMES JÚNIOR, C.C. Drought-tolerant maize genotypes invest in root system and maintain high harvest index during water stress. Revista Brasileira de Milho e Sorgo, v.15, p.451-461, 2016. DOI: https://doi.org/10.18512/1980-6477/rbms.v15n3p450-460.
https://doi.org/10.18512/1980-6477/rbms....
). PCA confirmed these results and determined that 93% of the differences among genotypes can be explained by the combination of two main components. The first component was strongly influenced by ear length and number of kernels per ear, while the second component was also influenced by above-ground dry matter, shoot dry matter, and plant height. Some of these traits have already been used successfully in the field, to discriminate corn genotypes in breeding programs aiming at tolerance to drought (Sousa et al., 2018SOUSA, R.D. de; BASTOS, E.A.; CARDOSO, M.J.; PEREIRA, D.R. Identification of drought-tolerant corn genotypes by multivariate analysis. Pesquisa Agropecuária Tropical, v.48, p.204-211, 2018. DOI: https://doi.org/10.1590/1983-40632018v4852122.
https://doi.org/10.1590/1983-40632018v48...
).
When performing a principal component analysis for physiological traits, 97.13% of the differences among genotypes under drought could be explained by two main components, both under strong influence of Fo, Fm, and Ci. However, when performing the daily selection of the most important traits, to discriminate corn genotypes responses to drought over the stress period using the VIFs, we found that Abs., CCM, CTleaf, and Fm were mostly chosen throughout time of stress, while Fo was selected from the middle to the end of the stress. WUE was selected for 5 days, and Ci was selected for 2 days. This means that these traits are strong candidates to be used in a breeding program aiming at tolerance to drought in corn. Indeed, some of them have been used successfully in sugarcane under field conditions (Silva et al., 2007SILVA, M. de A.; JIFON, J.L.; SILVA, J.A.G. da; SHARMA, V. Use of physiological parameters as fast tools to screen for drought tolerance in sugarcane. Brazilian Journal of Plant Physiology, v.19, p.193-201, 2007. DOI: https://doi.org/10.1590/S1677-04202007000300003.
https://doi.org/10.1590/S1677-0420200700...
). All of them have the advantage of being nondestructive and easily and quickly assessed.
As expected, the physiology of all corn genotypes under study was highly impacted by drought, especially those variables related to gas exchange rates, light capture, and utilization apparatus (Figure 5). Thus, the derived traits were able to discriminate the treatments. Moreover, their effects were different between drought-tolerant and drought-sensitive corn genotypes. In addition, although some traits were chosen more frequently to explain differences among treatments and genotypes, none could be chosen throughout the stress period. Since stress intensity was maintained constant, this indicates that over this period new drought-tolerance mechanisms came into play and, therefore, different traits became important. Consequently, the duration of stress influenced the selection of traits to discriminate contrasting genotypes for drought. Such a result may indicate the reason why it has been so controversial and difficult to obtain drought-tolerant plants based on a single physiological trait in plant breeding programs (Araus et al., 2012ARAUS, J.L.; SERRET, M.D.; EDMEADES, G.O. Phenotyping maize for adaptation to drought. Frontiers in Physiology, v.3, art.305, 2012. DOI: https://doi.org/10.3389/fphys.2012.00305.
https://doi.org/10.3389/fphys.2012.00305...
; Tardieu, 2012TARDIEU, F. Any trait or trait-related allele can confer drought tolerance: just design the right drought scenario. Journal of Experimental Botany, v.63, p.25-31, 2012. DOI: https://doi.org/10.1093/jxb/err269.
https://doi.org/10.1093/jxb/err269...
).
Conclusions
-
Ear length, number of grains per ear, above-ground dry matter, shoot dry matter, and plant height are the most important growth and yield variables to discriminate genotype-dependent drought tolerance in corn (Zea mays).
-
Chlorophyll content measurement, absorptivity, leaf temperature, maximum fluorescence in the dark-adapted state, minimum fluorescence in the dark-adapted state, water-use efficiency and intercellular CO2 concentration are the most important physiological variables to discriminate genotype-dependent drought tolerance in corn.
-
At the pre-flowering stage, the physiological traits are more effective than growth and yield ones to discriminate the responses of corn genotypes to drought; thus, DKB 390 genotype is confirmed as different from the others based on the traits of growth and yield, while 2B-707 and DKB-390 are considered as different from the 'BRS 1030' and 'BRS 1010' genotypes based on physiological traits.
Acknowledgments
To Coordenação de Aperfeiçoamento de Pessoal de Nível Superior (Capes, finance code 001), for fellowships granted to Thalita Massaro Malheiros Ferreira and Vivianny Nayse Belo Silva; to Financiadora de Estudos e Projetos (Finep) and Ministério da Ciência, Tecnologia e Inovação (MCTI) (grant number 01.11.0089.01), and to Embrapa/Projeto Phenocorn, for funding this research; to Embrapa Milho e Sorgo, especially to Dr. Lauro Guimarães, for corn seed supplying.
References
- ABENDROTH, L.J.; ELMORE, R.W.; BOYER, M.J.; MARLAY, S.K. Corn growth and development. Ames: Iowa State University, 2011. Available at: <Available at: https://store.extension.iastate.edu/Product/Corn-Growth-and-Development >. Accessed on: Jan. 10 2020.
» https://store.extension.iastate.edu/Product/Corn-Growth-and-Development - ARAUS, J.L.; SERRET, M.D.; EDMEADES, G.O. Phenotyping maize for adaptation to drought. Frontiers in Physiology, v.3, art.305, 2012. DOI: https://doi.org/10.3389/fphys.2012.00305.
» https://doi.org/10.3389/fphys.2012.00305 - AVILA, R.G.; MAGALHÃES, P.C.; ALVARENGA, A.A. de; LAVINSKI, A. de O.; CAMPOS, C.N.; SOUZA, T.C. de; GOMES JÚNIOR, C.C. Drought-tolerant maize genotypes invest in root system and maintain high harvest index during water stress. Revista Brasileira de Milho e Sorgo, v.15, p.451-461, 2016. DOI: https://doi.org/10.18512/1980-6477/rbms.v15n3p450-460.
» https://doi.org/10.18512/1980-6477/rbms.v15n3p450-460 - BADR, A.; EL-SHAZLY, H.H.; TARAWNEH, R.A.; BÖRNER, A. Screening for drought tolerance in maize (Zea mays L.) germplasm using germination and seedling traits under simulated drought conditions. Plants, v.9, art.565, 2020. DOI: https://doi.org/10.3390/plants9050565.
» https://doi.org/10.3390/plants9050565 - BITTELLI, M. Measuring soil water content: a review. HortTechnology, v.21, p.293-300, 2011. DOI: https://doi.org/10.21273/HORTTECH.21.3.293.
» https://doi.org/10.21273/HORTTECH.21.3.293 - CAMPOS, H.; COOPER, M.; HABBEN, J.E.; EDMEADES, G.O.; SCHUSSLER, J.R. Improving drought tolerance in maize: a view from industry. Field Crops Research, v.90, p.19-34, 2004. DOI: https://doi.org/10.1016/j.fcr.2004.07.003.
» https://doi.org/10.1016/j.fcr.2004.07.003 - CASARI, R.A.C.N.; PAIVA, D.S.; SILVA, V.N.B.; FERREIRA, T.M.M.; SOUSA JUNIOR, M.T.; OLIVEIRA, N.G.; KOBAYASHI, A.K.; MOLINARI, H.B.C.; SANTOS, T.T.; GOMIDE, R.L.; MAGALHÃES, P.C.; SOUSA, C.A.F. Using thermography to confirm genotypic variation for drought response in maize. International Journal of Molecular Sciences, v.20, art. 2273, 2019. DOI: https://doi.org/10.3390/ijms20092273.
» https://doi.org/10.3390/ijms20092273 - CHEN, D.; NEUMANN, K.; FRIEDEL, S.; KILIAN, B.; CHEN, M.; ALTMANN, T.; KLUKAS, C. Dissecting the phenotypic components of crop plant growth and drought responses based on high-throughput image analysis. Plant Cell, v.26, p.4636-4655, 2014. DOI: https://doi.org/10.1105/tpc.114.129601.
» https://doi.org/10.1105/tpc.114.129601 - EDMEADES, G.O.; BOLAÑOS, J.; CHAPMAN, S.C.; LAFITTE, H.R.; BÄNZIGER, M. Selection improves drought tolerance in tropical maize populations: I. Gains in biomass, grain yield, and harvest index. Crop Science, v.39, p.1306-1315, 1999. DOI: https://doi.org/10.2135/cropsci1999.3951306x.
» https://doi.org/10.2135/cropsci1999.3951306x - FAROOQ, M.; WAHID, A.; KOBAYASHI, N.; FUJITA, D.; BASRA, S.M.A. Plant drought stress: effects, mechanisms and management. Agronomy for Sustainable Development, v.29, p.185-212, 2009. DOI: https://doi.org/10.1051/agro:2008021.
» https://doi.org/10.1051/agro:2008021 - HASTIE, T.; TIBSHIRANI, R.; FRIEDMAN, J.H. The elements of statistical learning: data mining, inference and prediction. 2nd ed. New York: Springer, 2008. 745p.
- IUSS WORKING GROUP WRB. World Reference Base for Soil Resources 2014: international soil classification system for naming soils and creating legends for soil maps: update 2015. Rome: FAO, 2015. (FAO. World Soil Resources Reports, 106).
- JALEEL, C.A.; MANIVANNAN, P.; WAHID, A.; FAROOQ, M.; AL-JUBURI, H.J.; SOMASUNDARAM, R.; PANNEERSELVAM, R. Drought stress in plants: a review on morphological characteristics and pigments composition. International Journal of Agriculture and Biology, v.11, p.100-105, 2009.
- KHAN, A.; PAN, X.; NAJEEB, U.; TAN, D.K.Y.; FAHAD, S.; ZAHOOR, R.; LUO, H. Coping with drought: stress and adaptive mechanisms, and management through cultural and molecular alternatives in cotton as vital constituents for plant stress resilience and fitness. Biological Research, v.51, art.47, 2018. DOI: https://doi.org/10.1186/s40659-018-0198-z.
» https://doi.org/10.1186/s40659-018-0198-z - LI-COR BIOSCIENCES, INC. Using the LI-6400 / LI-6400XT. version 6. Lincoln, 2011. Available at: <Available at: https://www.licor.com/documents/s8zyqu2vwndny903qutg >. Accessed on: Dec. 5 2020.
» https://www.licor.com/documents/s8zyqu2vwndny903qutg - MASUKA, B.; ARAUS, J.L.; DAS, B.; SONDER, K.; CAIRNS, J.E. Phenotyping for abiotic stress tolerance in maize. Journal of Integrative Plant Biology, v.54, p.238-249, 2012. DOI: https://doi.org/10.1111/j.1744-7909.2012.01118.x.
» https://doi.org/10.1111/j.1744-7909.2012.01118.x - MUKAKA, M.M. Statistics corner: a guide to appropriate use of correlation coefficient in medical research. Malawi Medical Journal, v.24, p.69-71, 2012. DOI: https://doi.org/10.4314/MMJ.V24I3.
» https://doi.org/10.4314/MMJ.V24I3 - OBIDIEGWU, J.E.; BRYAN, G.J.; JONES, H.G.; PRASHAR, A. Coping with drought: stress and adaptive responses in potato and perspectives for improvement. Frontiers in Plant Science, v.6, art.542, 2015. DOI: https://doi.org/10.3389/fpls.2015.00542.
» https://doi.org/10.3389/fpls.2015.00542 - SAHEBI, M.; HANAFI, M.M.; RAFII, M.Y.; MAHMUD, T.M.M; AZIZI, P.; OSMAN, M.; ABIRI, R.; TAHERI, S.; KALHORI, N.; SHABANIMOFRAD, M.; MIAH, G.; ATABAKI, N. Improvement of drought tolerance in rice (Oryza sativa L.): genetics, genomic tools, and the WRKY gene family. BioMed Research International, v.2018, art.3158474, 2018. DOI: https://doi.org/10.1155/2018/3158474.
» https://doi.org/10.1155/2018/3158474 - SANTOS, H.G. dos; JACOMINE, P.K.T; ANJOS, L.H.C. dos; OLIVEIRA, V.A. de; LUMBRERAS, J.F.; COELHO, M.R.; ALMEIDA, J.A. de; ARAUJO FILHO, J.C. de; OLIVEIRA, J.B. de; CUNHA, T.J.F. Brazilian soil classification system. 5th ed. rev. and exp. Brasília: Embrapa, 2018. E-book.
- SHAREEF, M.; GUI, D.; ZENG, F.; AHMED, Z.; WAGAS, M.; ZHANG, B.; IQBAL, H.; FIAZ, M. Impact of drought on assimilates partitioning associated fruiting physiognomies and yield quality attributes of desert grown cotton. Acta Physiologiae Plantarum, v.40, art.71, 2018. DOI: https://doi.org/10.1007/s11738-018-2646-3.
» https://doi.org/10.1007/s11738-018-2646-3 - SILVA, M. de A.; JIFON, J.L.; SILVA, J.A.G. da; SHARMA, V. Use of physiological parameters as fast tools to screen for drought tolerance in sugarcane. Brazilian Journal of Plant Physiology, v.19, p.193-201, 2007. DOI: https://doi.org/10.1590/S1677-04202007000300003.
» https://doi.org/10.1590/S1677-04202007000300003 - SOUSA, C.A.F. de; PAIVA, D.S. de; CASARI, R.A. das C.N.; OLIVEIRA, N.G. de; MOLINARI, H.B.C.; KOBAYASHI, A.K.; MAGALHÃES, P.C.; GOMIDE, R.L.; SOUSA JR., M.T. A procedure for maize genotypes discrimination to drought by chlorophyll fluorescence imaging rapid light curves. Plant Methods, v.13, art.61, 2017. DOI: https://doi.org/10.1186/s13007-017-0209-z.
» https://doi.org/10.1186/s13007-017-0209-z - SOUSA, R.D. de; BASTOS, E.A.; CARDOSO, M.J.; PEREIRA, D.R. Identification of drought-tolerant corn genotypes by multivariate analysis. Pesquisa Agropecuária Tropical, v.48, p.204-211, 2018. DOI: https://doi.org/10.1590/1983-40632018v4852122.
» https://doi.org/10.1590/1983-40632018v4852122 - SOUZA, T.C. de; CASTRO, E.M. de; MAGALHÃES, P.C.; LINO, L. de O.; ALVES, E.T.; ALBUQUERQUE, P.E.P. de. Morphophysiology, morphoanatomy, and grain yield under field conditions for two maize hybrids with contrasting response to drought stress. Acta Physiologiae Plantarum, v.35, p.3201-3211, 2013. DOI: https://doi.org/10.1007/s11738-013-1355-1.
» https://doi.org/10.1007/s11738-013-1355-1 - SOUZA, T.C. de; MAGALHÃES, P.C.; CASTRO, E.M. de; DUARTE, V.P.; LAVINSKY, A.O. Corn root morphoanatomy at different development stages and yield under water stress. Pesquisa Agropecuária Brasileira, v.51, p.330-339, 2016. DOI: https://doi.org/10.1590/S0100-204X2016000400005.
» https://doi.org/10.1590/S0100-204X2016000400005 - TARDIEU, F. Any trait or trait-related allele can confer drought tolerance: just design the right drought scenario. Journal of Experimental Botany, v.63, p.25-31, 2012. DOI: https://doi.org/10.1093/jxb/err269.
» https://doi.org/10.1093/jxb/err269 - VADEZ, V.; KHOLOVA, J.; MEDINA, S.; KAKKERA, A.; ANDERBERG, H. Transpiration efficiency: new insights into an old story. Journal of Experimental Botany, v.65, p.6141-6153, 2014. DOI: https://doi.org/10.1093/jxb/eru040.
» https://doi.org/10.1093/jxb/eru040
Publication Dates
-
Publication in this collection
11 Jan 2021 -
Date of issue
Jan-Dec 2021
History
-
Received
28 Apr 2020 -
Accepted
22 Oct 2020


