Abstract
Drying is one of the stages of coffee processing and has been considered one of the factors that impact the quality of the final drink. In this sense, the present study developed a phenomenological model for a box-type dryer implementing in C / C ++ programming language. The profile of the exhaust air temperature was obtained over the drying time. The model was verified by comparing data obtained from the literature, thus guaranteeing its functionality to make predictions about the air temperature profile in equipment used by small coffee producers, which may contribute to the increase in product quality.
Keywords:
Exhaust temperature; Temperature; Small coffee producers; Quality of dry coffee; Free software; RStudio, coffee drying
Resumo
A secagem é uma das etapas do processamento do café e tem sido considerada um dos fatores que causam impacto na qualidade da bebida final. Neste sentido, o presente estudo desenvolveu um modelo fenomenológico para um secador tipo caixa, implementando-o em linguagem de programação C/C++. Foi obtido o perfil da temperatura de exaustão do ar ao longo do tempo de secagem. O modelo foi verificado por comparação de dados obtidos da literatura, garantindo, assim, sua funcionalidade para realizar previsões sobre o perfil da temperatura do ar em equipamentos utilizados por pequenos produtores de café, o que poderá contribuir para o aumento de qualidade do produto.
Palavras-chave:
Temperatura de exaustão; Temperatura; Pequenos produtores de café; Qualidade do café seco; Software livre; RStudio, secagem de café
1 Introduction
The coffee drink is very popular around the world due to its pleasant taste (Folmer et al., 2017Folmer, B., Farah, A., Jones, L., & Fogliano, V. (2017). Human wellbeing—sociability, performance, and health. In B. Folmer (Ed.)., The craft and science of coffee (pp. 493-520). Cambridge: Academic Press. http://dx.doi.org/10.1016/B978-0-12-803520-7.00020-7
http://dx.doi.org/10.1016/B978-0-12-8035...
). Coffee consumption has grown by an average of 1.9% over the past 50 years (Dong et al., 2018Dong, W., Hu, R., Long, Y., Li, H., Zhang, Y., Zhu, K., & Chu, Z. (2018). Comparative evaluation of the volatile profiles and taste properties of roasted coffee beans as affected by drying method and detected by electronic nose, electronic tongue, and HS-SPME-GC-MS. Food Chemistry, 272, 723-731. https://doi.org/10.1016/j.foodchem.2018.08.068.
https://doi.org/10.1016/j.foodchem.2018....
). According to the October 2020 coffee market report, global consumption was estimated at 10 million tons of green coffee beans for the 2019-20 coffee year (Organização Internacional do Café, 2020Organização Internacional do Café – OIC. (2020). Relatório sobre o mercado de café. Retrieved in 2021, February 20, from http://consorciopesquisacafe.com.br/arquivos/consorcio/publicacoes_tecnicas/relatorio_oic_outubro_2020.pdf
http://consorciopesquisacafe.com.br/arqu...
).
In the last decade, the drink has gained increasing importance due to its great potential for health (Farah, 2017Farah, A. (2017). Nutritional and health effects of coffee. In P. Lashermes (Ed.), Achieving sustainable cultivation of coffee breeding and quality traits. Cambridge: Burleigh Dodds Science Publishing.; Folmer et al., 2017Folmer, B., Farah, A., Jones, L., & Fogliano, V. (2017). Human wellbeing—sociability, performance, and health. In B. Folmer (Ed.)., The craft and science of coffee (pp. 493-520). Cambridge: Academic Press. http://dx.doi.org/10.1016/B978-0-12-803520-7.00020-7
http://dx.doi.org/10.1016/B978-0-12-8035...
). In addition to health benefits, coffee consumers also seek (for some mainly) sensory quality (Morris, 2017Morris, J. (2017). We Consumers —Tastes, Rituals, and Waves. In B. Folmer (Ed.), The craft and science of coffee (pp. 457-491). Cambridge: Academic Press. http://dx.doi.org/10.1016/B978-0-12-803520-7.00019-0.
http://dx.doi.org/10.1016/B978-0-12-8035...
). The preservation of coffee quality is related to the post-harvest, mainly the practices adopted in the processing (Livramento et al., 2017Livramento, K. G., Borém, F. M., José, A. C., Santos, A. V., Livramento, D. E., Alves, J. D., & Paiva, L. V. (2017). Proteomic analysis of coffee grains exposed to different drying process. Food Chemistry, 221, 1874-1882. https://doi.org/10.1016/j.foodchem.2016.10.069.
https://doi.org/10.1016/j.foodchem.2016....
; Guimarães, et al., 2019Guimarães, R. J., Borém, F. M., Shuler, J., Farah, A., & Romero, J. C. P. (2019). Coffee growing and post-harvest processing. In: A. Farah (Ed.), Coffee (pp. 26-88). Royal Society of Chemistry.; Hameed et al., 2018Hameed, A., Hussain, S. A., Ijaz, M. U., & Ullah, S. (2018). Farm to consumer: Factors affecting the organoleptic characteristics of coffee. II: postharvest processing factors. Comprehensive Reviews in Food Science and Food Safety, 17(5), 1184-1237. http://dx.doi.org/10.1111/1541-4337.12365
http://dx.doi.org/10.1111/1541-4337.1236...
; Pimentel et al., 2017Pimentel, U. F., Rabello, G. L., & Poubel, W. M. (2017). Application of Statistical Process Control (CEP) as a quality control method for the drying of coffee in a horizontal rotary dryer and process analysis. In Anais do XVII Encontro Latino Americano de Pós-graduação, XI Inic Jr da UNIVAP, VII INID (pp. 1-6). São José dos Campos: UNIVAP.). In post-harvest coffee, drying has been considered a determining factor in the quality of the final drink (Livramento, et al., 2017Livramento, K. G., Borém, F. M., José, A. C., Santos, A. V., Livramento, D. E., Alves, J. D., & Paiva, L. V. (2017). Proteomic analysis of coffee grains exposed to different drying process. Food Chemistry, 221, 1874-1882. https://doi.org/10.1016/j.foodchem.2016.10.069.
https://doi.org/10.1016/j.foodchem.2016....
).
Drying is a technique of preserving food, consisting of removing or reducing the water content of beans (about 11% to 12%) to decrease the growth of microorganisms (Guimarães, et al., 2019Guimarães, R. J., Borém, F. M., Shuler, J., Farah, A., & Romero, J. C. P. (2019). Coffee growing and post-harvest processing. In: A. Farah (Ed.), Coffee (pp. 26-88). Royal Society of Chemistry.; Hameed, et al., 2018Hameed, A., Hussain, S. A., Ijaz, M. U., & Ullah, S. (2018). Farm to consumer: Factors affecting the organoleptic characteristics of coffee. II: postharvest processing factors. Comprehensive Reviews in Food Science and Food Safety, 17(5), 1184-1237. http://dx.doi.org/10.1111/1541-4337.12365
http://dx.doi.org/10.1111/1541-4337.1236...
). There are several methods of drying coffee fruits, from traditional methods such as natural drying to the more sophisticated (Borém & Andrade, 2019Borém, F. M., & Andrade, E. T. (2019). Processing and drying of coffee. In C. L. Hii & F. M. Borém. Drying and roasting of cocoa and coffee (pp. 26-88). Boca Raton: CRC Press.). One of the types of dryers used for drying the beans is the “box drier”, created by Empresa de Assistência Técnica e Extensão Rural do Estado de Minas Gerais (EMATER-MG - in English Company of Technical Assistance and Rural Extension of the State of Minas Gerais) in 1996, which is commonly used by coffee producers because of their low assembly costs and because they perform the same functions as the traditional rotary coffee dryer (Centro do Comércio de Café do Estado de Minas Gerais, 2016Centro do Comércio de Café do Estado de Minas Gerais – CCMG. (2016). Modelo de secador mais econômico surge na zona da mata mineira e promete revolucionar a secagem de café. Retrieved in 2019, January 28, from http://cccmg.com.br/modelo-de-secador-mais-economico-surge-na-zona-da-mata-mineira-e-promete-revolucionar-a-secagem-de-cafe/
http://cccmg.com.br/modelo-de-secador-ma...
).
Numerous studies could address the coffee drying process, devoting the determination of grain properties and the implementation of empirical models (Isquierdo et al., 2013Isquierdo, E. P., Borém, F.M., de Andrade, E. T., Corrêa, J. L. G., de Oliveira, P. D., & Alves, G. E. (2013). Drying kinetics and quality of natural coffee. Transactions of the ASABE, 56(3), 995-1001.; Nilnont et al., 2012Nilnont, W., Thepa, S., Janjai, S., Kasayapanand, N., Thamrongmas, C., & Bala, B. K. (2012). Finite element simulation for coffee (Coffea arabica) drying. Food and Bioproducts Processing, 90(2), 341-350. http://dx.doi.org/10.1016/j.fbp.2011.06.007
http://dx.doi.org/10.1016/j.fbp.2011.06....
; Siqueira et al., 2017 Siqueira, V. C., Borém, F. M., Alves, G. E., Isquierdo, E. P., Pinto, A. C. F., Ribeiro, D. E., & Ribeiro, F. C. (2017). Drying kinetics of processed natural coffee with high moisture content. Coffee Science, 12(3), 400-409.; Tesfa et al., 2019Tesfa, M., Abera, S., & Sualeh, A. (2019). Some engineering physical properties of beans of selected cultivars of coffee (Coffea arabica L.) Grown in South West, Ethiopia. Asian Journal of Science and Technology, 10(10), 10299-10307.), therefore, little is known about the phenomenological behavior of the drying process variables, which makes its control difficult (Rabello & Pimentel, 2017Rabello, G. L., & Pimentel, U. F. (2017). Modelagem e Simulação de um secador de leito fixo para grãos de café utilizando programação C/C++ (Final Year Project). Universidade Federal do Espírito Santo, Alegre.). For this reason, the present study carried out phenomenological modeling of a box type dryer, using the C / C + programming language. The model was verified by comparing data from the literature, thus guaranteeing its functionality to make predictions about the air temperature profile, which may contribute to improving temperature control, and, consequently, increasing product quality and price.
2 Methodology
2.1 Software and the dryer
The simulations were performed in Geany software on Ubuntu, C / C ++ programming was performed on a personal computer with the following configuration., Intel® Core™ i7-4510U CPU @ 2.00GHz-2.60GHz with a RAM of 8.00 GB. In order to plot the data, the RStudio 1.0.44. software was used.
The geometry of the system was defined according to the type of dryer, in this case, a box type dryer. The dimensions and procedures adopted were the same as those of Lacerda Filho & Silva (2005)Lacerda Filho, A. F. & Silva, J. S. (2005). Coffee drying in combination. Brazilian Journal of Agricultural and Environmental Engineering, 10(3), 671-678..
The Figure 1 presents a schematic of the geometry, dimensions a, b and c were related to height, width and length, respectively. It was also possible to observe the input vectors and the output vectors of the flow.

2.2 Equation and considerations
To perform the simulations, the following boundary conditions were considered: If there are fixed parts, the fluid velocity will be zero; The input of the hot source in the equipment occurs at the bottom constantly in the space and simulation time; The top of the equipment is open so that the temperature at the outlet is close to the value even closer to the inside of the equipment, so that the temperature derivative along the space at that point is zero, for speed. The initial condition was that the fluid at the beginning of the process was stagnant.
Then, 50 volumes were used in the direction of space (x, y, z), and a variation of 1 second for the time variable. Such mesh conditions and temporal variation were assumed because an increase in the number of elements would cause a significant increase in computational time, in contrast a lower value could lead to an instability in the system.
The mesh convergence analysis was not performed since the computational cost required for this procedure exceeded the configurations of the available equipment to perform the computational simulations.
An energy balance was performed according to Bejan (2004)Bejan, A. (2004). Heat transfer (540 p.). São Paulo: Edgard Blucher Ltda., Equations 1 and 2, assuming that in each volume performed in the discretization the temperature of the gas was influenced by the temperature in its surroundings.
and:
Where: ρ is the density of the fluid; 𝑐𝑝 is the specific heat; μ is the viscosity of the fluid; u, v, w are the velocity profiles in the directions of the Cartesian axes x, y e z respectively; T and the temperature; q is the term that represents positive or negative source of heat inside the equipment.
For the purposes of simplifying the balance equation (Equations 1 and 2) in which the term “q” referring to the first equation was disregarded, the heat treatment will be performed later. The following contour and initial conditions were also assumed in order to perform the integration of Equations 1 and 2: At the beginning of the process the temperature inside the equipment equals ambient temperature; the inlet temperature equals the temperature of your heating source; in the wall no change in temperature occurs due to the initial conditions; the exit will be an open wall.
Due to the existence of the terms u, v and w in Equation 1, it was necessary to use the quantity of movement, which according to Fox et al. (2004)Fox, R. W., Mcdonald, A. T., & Pritchard, P. J. (2004). Introduction to fluid mechanics (6. ed.). Rio de Janeiro: LTC., Equations 3 to 5.
where: 𝑉 represents a velocity vector; 𝑥, 𝑦, 𝑧 are the spatial axes of the Cartesian coordinates; t is the term referring to time dimension; 𝑢, 𝑣, 𝑤 means the velocity values in the x, y and z directions (respectively); 𝜌 is the density of the fluid; 𝜇 is the viscosity of the fluid; 𝑔𝑥, 𝑔𝑦, 𝑔𝑧 represents the value of gravity in each spatial dimension; 𝑃 is the pressure; 𝜕 is the partial derivative of a variable and 𝛻.𝑉⃗ is the rate of volumetric expansion.
The velocity profile determination was independently calculated at temperature, using a simplification of the models (Equations 3, 4 and 5) in which the severity and pressure variations were disregarded.
It was necessary to use numerical sub-relaxation method to integrate the equations from the energy balance and momentum. This method required the calculation of a relaxation factor, Equation 6. Two relaxation factors were calculated, one for the resolution of the temperature model and one for the speed.
The relaxation factor used for speed was proposed by Lopes et al. (2001)Lopes, A. M. G., Sousa, A. C. M., & Viegas, D. X. (2001). GRID3D - A code for numerical generation of structured generalized Meshes. Ingenium, 56, 75-80., Equation 6. Where β could represent how much the variable has been incremented, n was the interaction of the method and the max index could represent the maximum.
For the temperature simulation, a constant value of the relaxation factor was established at each time interval.
2.3 Revolvement of the grains of coffee
The coffee bed consists of coffee and empty spaces (volumes that allow air to pass through), the percentage of the volume filled by the grains in relation to the voids between the grains inside the equipment was obtained from the porosity of the coffee bed. The porosity used was approximately 0.53 corresponding to the porosity obtained experimentally by Rabello & Pimentel (2017)Rabello, G. L., & Pimentel, U. F. (2017). Modelagem e Simulação de um secador de leito fixo para grãos de café utilizando programação C/C++ (Final Year Project). Universidade Federal do Espírito Santo, Alegre. at bed height of 0.5 m.
The grains inside the equipment, as in the practice of drying, are static (a defined / fixed spatial position). However, it is necessary to stir the grains so that they do not burn.
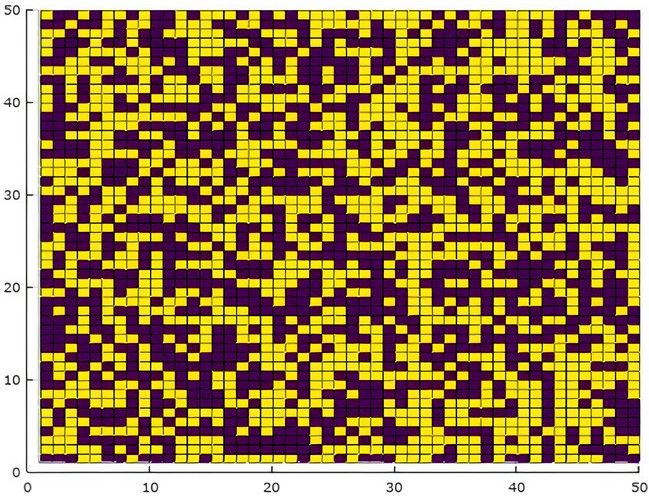
In this sense, in order to include this model to the model, it was proposed a random and probabilistic rotation of the grains throughout the equipment, i.e., the grains have their positions changed by a probability weighted by the porosity of the bed. Thus, the grains will occupy a new position in the space, generating a new bed. Figure 2 illustrates the coffee bed layout for an instant of time.

In Figure 2, the dark area represents the region of the equipment at an instant of time where there is a possible existence of the grain, so the air velocity for that position is zero. Thus, for this case, the boundary condition for the air was used.
The light arame represents the opposite, i.e., it represents the discretized volume for the instant of time where there is a possible passage of the air flow, and thus the momentum balance equation was used.
2.4 Computational procedure: logic and steps
2.4.1 Programming logic: velocity and temperature
The computational procedure for determining the velocity values and temperature values can be observed in Figure 3a and b.

(A) Computational procedure to determine the velocity; (B) Computational procedure to determine the temperature.
2.4.2 Steps to determine the velocity
A code was generated in C / C ++ programming which followed the programming logic described in Figure 3A, where the numbers correspond to the steps used to implement the codes, which, in short, mean:
-
1
Add known values of the problem, such as information contained in the literature, information taken from the article to compare, and system constants and parameters;
-
2
Establish the position of the grains randomly and proportionally to the value of porosity of the bed, which was obtained experimentally;
-
3
Establish the initial conditions of the process;
-
4
Establish contour conditions if possible and necessary;
-
5
Assume the highest allowable value used in relaxation. For the use of the sub-relation, it established a unit value.
-
6
Initialize the temporal integration of the velocity model;
-
7
Set an approximation for the next step of time;
-
8
Estimate the value for the next step of time taking into account the model based on the amount of movement;
-
9
Perform the calculation of the relaxation factor taking into account the proposed mathematical formulation;
-
10
Apply the sub-relaxation method to the calculated velocity value;
-
11
To verify if, with the method, the value of the variable in each volume is reasonable, that is, the method obtained the convergence at that point in that instant of time;
-
12
Similar to step 11, however, in this case, it applies after the calculation of that time instant and several sets of elements are checked to see if it remains reasonable. At that time, parallel planes were admitted to the input along the Z axis;
-
13
If steps 11 and 12 reached non-conclusive results, a possible solution would be to reduce the maximum relaxation value, using the factor established in the first step;
-
14
As the value of the variable was calculated from an empirical data, it is necessary to calculate the difference of the calculated value and the established kick, thus determining its error;
-
15
Thus, it was established that the method converged at that time instant if the largest error of the set of all the volume elements is less than a tolerance defined in the first step;
-
16
In order to take into account the grain turnover, it is verified whether or not it is time to stir the grains, using a comparison with the time of the interaction with the time realized by the experiment of Lacerda Filho & Silva (2005)Lacerda Filho, A. F. & Silva, J. S. (2005). Coffee drying in combination. Brazilian Journal of Agricultural and Environmental Engineering, 10(3), 671-678.. If so, the program proceeds to the next step (17) before returning to the method;
-
17
Grain turnover similar to step 2;
-
18
This step will be described separately in the topic of the computational procedure for the temperature profile;
-
19
Find out if the simulated time has reached the one defined in step 1, i.e., the total drying time;
-
20
This step corresponds to all the calculations required to enable data analysis;
-
21
Save results to files to allow access when needed.
During steps 11 and 12 to ascertain the result, it could be established a speed limit, which assumes that all the mass that enters the equipment passes through a single discretized volume. As the velocity can not exceed this value, it made the comparison of each discretized volume constructed along the equipment with the speed limit. If the speed did not exceed this limit, it was considered an approximation of the speed value for the calculation of temperature. Otherwise the result does not represent the physical problem, in which case the comparison is performed immediately to calculate the speed. The same comparison was made using planes along the equipment with the speed limit.
2.4.3 Steps to determine the temperature
For the determination of the temperature, a code was implemented in C / C ++ programming following the logic of programming described in Figure 3B, where the numbers correspond to the steps used to implement the codes, which, in short, mean:
-
1
To establish the conditions based on literature and experimental data found in articles;
-
2
Establish the conditions for the start of the process;
-
3
Establish boundary conditions;
-
4
Assume the highest value allowed, used in relaxation. In this case, the unit value was used, because it is desired to use sub-relaxation;
-
5
Initialize the temporal integration of the temperature model;
-
6
Set an approximation for the next step of time;
-
7
Estimate the value for the next step of time taking into consideration the energy balance based model;
-
8
Perform the calculation of the relaxation factor considering the proposed mathematical formulation;
-
9
Apply the sub-relaxation method to the calculated temperature value;
-
10
Check that, with the method, the value of the variable in each control volume element is reasonable, that is, the method obtained convergence at that point in that time instant. In this case, it has been found that the temperature of each element does not exceed the temperature of the hot source (furnace) and is not lower than the temperature of the cold source (in this case, the ambient temperature);
-
11
If step 10 checks the non-conclusive results, a possible solution would be to reduce the maximum relaxation value using the factor established in the first step;
-
12
Since the value of the variable was calculated from an empirical value, it is necessary to calculate the difference of the calculated value and the empirical value established, thus determining its error;
-
13
In this way, it establishes that the method converged at that instant of time, if the largest error of the set of all the volume elements is less than a tolerance defined in the first step;
-
14
Find out if the simulated time has reached the one defined in step 1;
-
15
Additional calculations needed for comparison;
-
16
Save results to files.
So far the heat generated or absorbed during the drying process has not been considered, however, the grain present in the equipment loses water to the nvironment, absorbing part of the energy present in the drying air, to take into account that influence used the experimental data of Lacerda Filho & Silva (2005)Lacerda Filho, A. F. & Silva, J. S. (2005). Coffee drying in combination. Brazilian Journal of Agricultural and Environmental Engineering, 10(3), 671-678., in order to calculate the energy absorbed by the total mass of coffee during the initial and final time of the drying operation. This phenomenon is taken into account only at the end of the program in step 15 in the final calculations. For the calculation of the heat absorbed by the grain, the following mathematical formulation was proposed by Rabello & Pimentel (2017)Rabello, G. L., & Pimentel, U. F. (2017). Modelagem e Simulação de um secador de leito fixo para grãos de café utilizando programação C/C++ (Final Year Project). Universidade Federal do Espírito Santo, Alegre., described by Equation 7.
Where: The “ ” represents a discretized volume and the “total” represents the entire interior of the equipment. is the heat absorbed by the coffee bean and is the temperature variation. The term “” is all the energy the grain needs to produce the loss of water to the environment.
With this simulation result, one has the temperature profile along the drying equipment. For the comparison with the article by Lacerda Filho & Silva (2005)Lacerda Filho, A. F. & Silva, J. S. (2005). Coffee drying in combination. Brazilian Journal of Agricultural and Environmental Engineering, 10(3), 671-678., the average exhaust temperature was calculated, obtaining an arithmetic mean and the standard deviation considering as sample data the elements at the exit of the equipment and disregarding those that represented wall.
2.5 Variables of the simulations
Values for the constants used were: air density is 0,0000178 [kg/m s] at 10 °C; thermal conductivity of the air is 0,02492 [w/m K] at 10 °C; specific heat of the air is 1,0048 [kJ/kg °C]; enthalpy of vaporization of water is 44045 [kJ/kg mol] to 760 [mmHg] (Geankoplis, 2003Geankoplis, C. J. (2003). Transport processes and separation process principles: Includes unit operations (4th ed., 1026 p.). Upper Saddle River: Prentice-hall.). The specific heat of the grain was obtained experimentally by Afonso Júnior (2001)Afonso Júnior, P. C. (2001). Aspectos físicos, fisiológicos e de qualidade do café em função da secagem e do armazenamento (Tese de doutorado). Universidade Federal de Viçosa, Viçosa. (average between 1,2254 and 2,4653); the molar masses by IUPAC (International Union of Pure and Applied Chemistry, 2017International Union of Pure and Applied Chemistry – IUPAC. (2017). Periodic table of the elements. Retrieved in 2017, October 17, from https://iupac.org/whatwe-do/periodic-table-of-elements/
https://iupac.org/whatwe-do/periodic-tab...
) .
The following variables, Initial Humidity (bu), Final Humidity (bu), Initial Coffee Temperature, Coffee Final Temperature, Initial Density, Drying Temperature, Ambient Temperature, Exhaustion Temperature and Operating Time were the same as those obtained by Lacerda Filho & Silva (2005)Lacerda Filho, A. F. & Silva, J. S. (2005). Coffee drying in combination. Brazilian Journal of Agricultural and Environmental Engineering, 10(3), 671-678. in each of the three experimental tests.
With the codes implemented, according to the presented methodology, five repetitions were performed for three different tests in different conditions, besides that for the first test 20 repetitions were performed for the first two hours of the process in the simulations.
3 Results and discussion
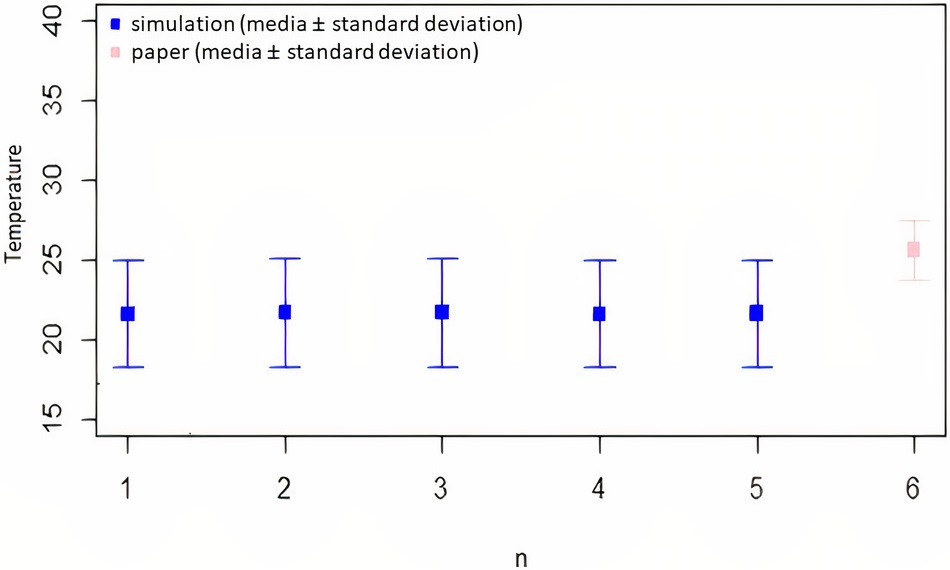
With the repetitions of the simulation for the first test and with the aid of RStudio software, the Figures 4, 5 and 6 were obtained.


The first five points configured the results of this simulation and the last one indicated the result of the experiment produced by Lacerda Filho & Silva (2005)Lacerda Filho, A. F. & Silva, J. S. (2005). Coffee drying in combination. Brazilian Journal of Agricultural and Environmental Engineering, 10(3), 671-678.. It is noticed that the calculated values in relation to the experimental one are similar, however there is a difference between the deviations, this phenomenon can be justified by the form in which the agitation of the grains was considered, in which in this work considered only in the effect of speed, however there is the possibility of thermal exchange at that time between the environment and equipment and between a discretized volume and its neighbors.
When analyzing the Figures 4, 5 and 6 it can be seen that the values obtained by the simulation presented their magnitude higher than that obtained experimentally. This result is coherent, since in this experiment the author performs an interruption during the drying process, which allows thermal changes between the interior of the equipment with the environment, causing in the reduction of the temperature.
It is observed that the values generated in this simulation obtained higher magnitude than the values obtained experimentally, this may have occurred due to the increase of temperature of the hot source during the last stages of the drying stage, a phenomenon also observed when analyzing the data of Lacerda Filho & Silva (2005)Lacerda Filho, A. F. & Silva, J. S. (2005). Coffee drying in combination. Brazilian Journal of Agricultural and Environmental Engineering, 10(3), 671-678..
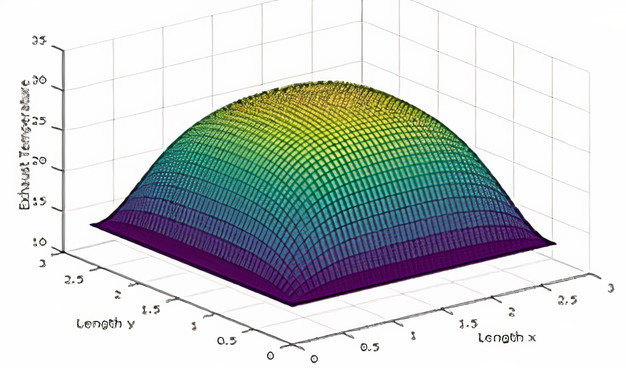
With this simulation methodology, the temperature profile was obtained along Cartesian axes, the three tests obtained similar profiles, so it will be presented only the results to stop the first test in the last repetition. For the simulations presented through Figures 7, 8 and 9, the Octave software was used


With Figure 7, we had a maximum point inside the equipment and at the entrance of the equipment, reducing the approach to the wall due to the established boundary condition, or as we moved in the positive z-axis direction, due to the remoteness of the hot source.
When comparing Figures 8 and 9, a similar behavior was observed, however with different magnitudes, in which the second case represents a smaller value, this behavior occurs because in the first case the heat absorbed by the particle was disregarded, resulting in a higher temperature value.
For the first test, a 2-hour process simulation was performed, obtaining the following results (Figure 10). Note the presence of preferential regions during the first few minutes of drying (Figures 10a, b, c e d), occurring due to the grain position that was considered in this problem, where it occurred at random and depended on each simulation. With the final minutes of this simulation stage a behavior was formed in the temperature profile, differentiating over time only by the value of the variable, observed by the scale of the graph (Figures 10e, f, g, h e i).

Temperature for different simulation times of: (a) 0 s; (b) 600 s; (c) 1200 s; (d) 1800 s; (e) 2400 s; (f) 3000 s; (g) 3600; s (h) 5400 s; (i) 7200 s.
For this test, the average values of the output temperature were stored up to the total simulation time, thus generating Figure 11.

Average exhaust temperature of the air during the drying process, disregarding the heat term.
It was possible to observe that the exhaust temperature of the air could increase until reaching a maximum value that remained constant until the final step of the process, at which point the system was falling under a permanent regime.
4 Conclusion
The drying of coffee in a box dryer was represented by a phenomenological modeling. The model implemented was checked with literature date, concluding that the temperature results were consistent. Thus, the model was adequate for air temperature predictions along cartesian axes (x, y, z) and along the drying time. This way it can be used by small coffee producer, and it will be able to contribute to improving temperature control and increasing product quality.
-
Funding: None
References
- Afonso Júnior, P. C. (2001). Aspectos físicos, fisiológicos e de qualidade do café em função da secagem e do armazenamento (Tese de doutorado). Universidade Federal de Viçosa, Viçosa.
- Bejan, A. (2004). Heat transfer (540 p.). São Paulo: Edgard Blucher Ltda.
- Borém, F. M., & Andrade, E. T. (2019). Processing and drying of coffee. In C. L. Hii & F. M. Borém. Drying and roasting of cocoa and coffee (pp. 26-88). Boca Raton: CRC Press.
- Centro do Comércio de Café do Estado de Minas Gerais – CCMG. (2016). Modelo de secador mais econômico surge na zona da mata mineira e promete revolucionar a secagem de café Retrieved in 2019, January 28, from http://cccmg.com.br/modelo-de-secador-mais-economico-surge-na-zona-da-mata-mineira-e-promete-revolucionar-a-secagem-de-cafe/
» http://cccmg.com.br/modelo-de-secador-mais-economico-surge-na-zona-da-mata-mineira-e-promete-revolucionar-a-secagem-de-cafe/ - Dong, W., Hu, R., Long, Y., Li, H., Zhang, Y., Zhu, K., & Chu, Z. (2018). Comparative evaluation of the volatile profiles and taste properties of roasted coffee beans as affected by drying method and detected by electronic nose, electronic tongue, and HS-SPME-GC-MS. Food Chemistry, 272, 723-731. https://doi.org/10.1016/j.foodchem.2018.08.068
» https://doi.org/10.1016/j.foodchem.2018.08.068 - Farah, A. (2017). Nutritional and health effects of coffee. In P. Lashermes (Ed.), Achieving sustainable cultivation of coffee breeding and quality traits Cambridge: Burleigh Dodds Science Publishing.
- Folmer, B., Farah, A., Jones, L., & Fogliano, V. (2017). Human wellbeing—sociability, performance, and health. In B. Folmer (Ed.)., The craft and science of coffee (pp. 493-520). Cambridge: Academic Press. http://dx.doi.org/10.1016/B978-0-12-803520-7.00020-7
» http://dx.doi.org/10.1016/B978-0-12-803520-7.00020-7 - Fox, R. W., Mcdonald, A. T., & Pritchard, P. J. (2004). Introduction to fluid mechanics (6. ed.). Rio de Janeiro: LTC.
- Geankoplis, C. J. (2003). Transport processes and separation process principles: Includes unit operations (4th ed., 1026 p.). Upper Saddle River: Prentice-hall.
- Guimarães, R. J., Borém, F. M., Shuler, J., Farah, A., & Romero, J. C. P. (2019). Coffee growing and post-harvest processing. In: A. Farah (Ed.), Coffee (pp. 26-88). Royal Society of Chemistry.
- Hameed, A., Hussain, S. A., Ijaz, M. U., & Ullah, S. (2018). Farm to consumer: Factors affecting the organoleptic characteristics of coffee. II: postharvest processing factors. Comprehensive Reviews in Food Science and Food Safety, 17(5), 1184-1237. http://dx.doi.org/10.1111/1541-4337.12365
» http://dx.doi.org/10.1111/1541-4337.12365 - International Union of Pure and Applied Chemistry – IUPAC. (2017). Periodic table of the elements Retrieved in 2017, October 17, from https://iupac.org/whatwe-do/periodic-table-of-elements/
» https://iupac.org/whatwe-do/periodic-table-of-elements/ - Isquierdo, E. P., Borém, F.M., de Andrade, E. T., Corrêa, J. L. G., de Oliveira, P. D., & Alves, G. E. (2013). Drying kinetics and quality of natural coffee. Transactions of the ASABE, 56(3), 995-1001.
- Lacerda Filho, A. F. & Silva, J. S. (2005). Coffee drying in combination. Brazilian Journal of Agricultural and Environmental Engineering, 10(3), 671-678.
- Livramento, K. G., Borém, F. M., José, A. C., Santos, A. V., Livramento, D. E., Alves, J. D., & Paiva, L. V. (2017). Proteomic analysis of coffee grains exposed to different drying process. Food Chemistry, 221, 1874-1882. https://doi.org/10.1016/j.foodchem.2016.10.069
» https://doi.org/10.1016/j.foodchem.2016.10.069 - Lopes, A. M. G., Sousa, A. C. M., & Viegas, D. X. (2001). GRID3D - A code for numerical generation of structured generalized Meshes. Ingenium, 56, 75-80.
- Morris, J. (2017). We Consumers —Tastes, Rituals, and Waves In B. Folmer (Ed.), The craft and science of coffee (pp. 457-491). Cambridge: Academic Press. http://dx.doi.org/10.1016/B978-0-12-803520-7.00019-0
» http://dx.doi.org/10.1016/B978-0-12-803520-7.00019-0 - Nilnont, W., Thepa, S., Janjai, S., Kasayapanand, N., Thamrongmas, C., & Bala, B. K. (2012). Finite element simulation for coffee (Coffea arabica) drying. Food and Bioproducts Processing, 90(2), 341-350. http://dx.doi.org/10.1016/j.fbp.2011.06.007
» http://dx.doi.org/10.1016/j.fbp.2011.06.007 - Organização Internacional do Café – OIC. (2020). Relatório sobre o mercado de café Retrieved in 2021, February 20, from http://consorciopesquisacafe.com.br/arquivos/consorcio/publicacoes_tecnicas/relatorio_oic_outubro_2020.pdf
» http://consorciopesquisacafe.com.br/arquivos/consorcio/publicacoes_tecnicas/relatorio_oic_outubro_2020.pdf - Pimentel, U. F., Rabello, G. L., & Poubel, W. M. (2017). Application of Statistical Process Control (CEP) as a quality control method for the drying of coffee in a horizontal rotary dryer and process analysis. In Anais do XVII Encontro Latino Americano de Pós-graduação, XI Inic Jr da UNIVAP, VII INID (pp. 1-6). São José dos Campos: UNIVAP.
- Rabello, G. L., & Pimentel, U. F. (2017). Modelagem e Simulação de um secador de leito fixo para grãos de café utilizando programação C/C++ (Final Year Project). Universidade Federal do Espírito Santo, Alegre.
- Siqueira, V. C., Borém, F. M., Alves, G. E., Isquierdo, E. P., Pinto, A. C. F., Ribeiro, D. E., & Ribeiro, F. C. (2017). Drying kinetics of processed natural coffee with high moisture content. Coffee Science, 12(3), 400-409.
- Tesfa, M., Abera, S., & Sualeh, A. (2019). Some engineering physical properties of beans of selected cultivars of coffee (Coffea arabica L.) Grown in South West, Ethiopia. Asian Journal of Science and Technology, 10(10), 10299-10307.
Publication Dates
-
Publication in this collection
06 Sept 2021 -
Date of issue
2021
History
-
Received
01 Dec 2020 -
Accepted
31 Mar 2021