
Abstract:
Determinations of the vertical ionospheric gradient standard deviation (σvig ) in real time to each Global Positioning System (GPS) and Globalnaya Navigatsionnaya Sputnikovaya Sistema (GLONASS) satellite available in Ground-Based Augmentation System (GBAS) of the Rio de Janeiro International Airport (SBGL) were used in the estimates of Horizontal and Vertical Protection Level (HPL/VPL). For this purpose two software were developed: MoR_Ion_RT (real time ionospheric threat assessment for GBAS in Brazil) and SBGL_PL (calculation of SBGL HPL/VPL), whose methods and equations are presented in this paper. Since such determinations transmit the real ionospheric condition at the time of an approaching aircraft, they also allow performing the screening of the data, based on the Conterminous United States (CONUS) Threat Model threshold. Experiments carried out indicate that it is possible to attend CAT-I during the autumn (most affected season) at SBGL using GPS or GLONASS satellites, provided that the restrictions established by a temporal ionospheric threat model developed for the region are applied (avoid satellites with elevations between 10° and 37°). It was also found that the use of GLONASS in conjunction with GPS satellites makes it possible to meet CAT-III Horizontal and Vertical Alert Limit (HAL/VAL), since it has a better geometric configuration.
Keywords:
GBAS; HPL; Ionospheric Threat Model; σvig; VPL
1. Introduction
Among the Global Navigation Satellite System (GNSS) positioning methods that can be used in air navigation to assist the phase of the precise approach, Ground-Based Augmentation System (GBAS) stands out (Hofmann-Wellenhof et al. 2008Hofmann-Wellenhof, B., Lichtenegger, H., Wasle, E. 2008. GNSS - Global Navigation Satellite Systems: GPS, GLONASS, Galileo, and more. New York: Springer-Verlag Wien.; Monico 2008Monico, J. F. G. 2008. Posicionamento pelo GNSS: descrição, fundamentos e aplicações. São Paulo: Editora da UNESP.).
The augmentation system based on ground stations has the ability to correct most errors that affect pseudoranges with the use of Differential GNSS (DGNSS), assuming that the ionospheric layer has similar behavior in the vicinity of the airport. However, depending on the flow of solar ionization, the sunspot cycle, geomagnetic activity, local time and geographic location, the ionosphere can suffer severe disturbances, posing a threat to the integrity of GBAS, since the ionospheric effects may be different for short distances.
Several pieces of research about systematic errors due to the ionospheric layer in GBAS have been carried out since 2000, such as: Luo et al. (2003Luo, M., Pullen, S., Dennis, J., Konno, H., Xie, G., Walter, T., Enge, P., Datta-Barua, S., Dehel, T. 2003. LAAS ionosphere spatial gradient threat model and impact of LGF and airborne monitoring. In: INTERNATIONAL TECHNICAL MEETING OF THE SATELLITE DIVISION OF THE INSTITUTE OF NAVIGATION ION GPS/GNSS, 16., Portland. Proceedings…, Portland. ), Luo et al. (2005)Luo, M., Pullen, S., Datta-Barua, S., Zhang, G., Walter, T., Enge, P. 2005. LAAS study of slow-moving ionosphere anomalies and their potential impacts. In: INTERNATIONAL TECHNICAL MEETING OF THE SATELLITE DIVISION OF THE INSTITUTE OF NAVIGATION, 18., ION GNSS 2005, Long Beach. Proceedings … , Long Beach, p. 2337-2349. , Ene et al. (2005Ene, A., Qiu, D., Luo, M., Pullen, S., Enge, P. 2005. A comprehensive ionosphere storm data analysis method to support LAAS threat model development. In: ION 2005 NATIONAL TECHNICAL MEETING, San Diego. Proceedings …, San Diego, p. 110-130.), Lee et al. (2007Lee, J., Pullen, S., Datta-Barua, S., Enge, P. 2007. Assessment of ionosphere spatial decorrelation for Global Positioning System-Based aircraft landing systems. J Aircr 44(5): 1662-1669.), Pullen et al. (2009Pullen, S., Park, Y. S., Enge, P. 2009. Impact and mitigation of ionospheric anomalies on Ground-Based Augmentation of GNSS. Radio Sci 44(1). ), Mayer et al. (2009Mayer, C., Belabbas, B., Jakowski, N., Meurer, M., Dunkel, W. 2009. Ionosphere threat space model assessment for GBAS. In: INTERNATIONAL TECHNICAL MEETING OF THE SATELLITE DIVISION OF THE INSTITUTE OF NAVIGATION, 22., Savannah. Proceedings … , Savannah, p. 1091-1099.), Datta-Barua et al. (2010Datta-Barua, S., Lee, J., Pullen, S., Luo, M., Ene, A., Qiu, D., Zhang, G., Enge, P. 2010. Ionospheric threat parameterization for local area Global-Positioning-System-Based aircraft landing systems. J Aircr 47(4): 1141-1151.), Lee et al. (2011a)Lee, J., Datta-Barua, S., Zhang, G., Pullen, S., Enge, P. 2011a. Observations of low-elevation ionospheric anomalies for Ground-Based Augmentation of GNSS. Radio Sci 46(6): 1-11., Lee et al. (2011b)Lee, J., Seo, J., Park, Y. S., Pullen, S., Enge, P. 2011b. Ionospheric threat mitigation by geometry screening in Ground-Based Augmentation Systems. J Aircr 48(4): 1422-1433., Jung & Lee (2012Jung, S., Lee, J. 2012. Long-term ionospheric anomaly monitoring for Ground Based Augmentation Systems. Radio Sci 47(4): 1-12.), Wang et al. (2014Wang, Z., Macabiau, C., Zhang, J., Escher, A. C. 2014. Prediction and analysis of GBAS integrity monitoring availability at LinZhi airport. GPS Solut 18(1): 27-40.), Kim et al. (2014Kim, J., Lee, S. W., Lee, H. K. 2014. An annual variation analysis of the ionospheric spatial gradient over a regional area for GNSS applications. Adv Space Res 54(3): 333-341.), Yoon & Lee (2014Yoon, M., Lee, J. 2014. Medium-scale traveling ionospheric disturbances in the Korean region on 10 November 2004: Potential impact on GPS-Based Navigation Systems. Space Weather 12(4): 173-186.), Srinivas et al. (2014Srinivas, V. S., Sarma, A. D., Reddy, A. S., Reddy, D. K. 2014. Investigation of the effect of ionospheric gradients on GPS signals in the context of LAAS. Progr Electromagn Res 57: 191-205.), Kim et al. (2015)Kim, M., Choi, Y., Jun, H. S., Lee, J. 2015. GBAS ionospheric threat model assessment for category I operation in the Korean region. GPS Solut 19(3): 443-456., Sánchez-Naranjo et al. (2017Sánchez-Naranjo, S., Rincón, W., Ramos-Pollán, R., González, F. A., Soley, S. 2017. A comprehensive assessment of ionospheric gradientes observed in Ecuador during 2013 and 2014 for ground based augmentation systems. Adv Space Res 59(8): 1992-2006.) and Barros et al. (2018Barros, D., Takahashi, H., Wrasse, C. M., Figueiredo, C. A. O. B. 2018. Characteristics of equatorial plasma bubbles observed by TEC map based on ground-based GNSS receivers over South America. Ann Geophys 36(1): 91-100.), emphasizing that the subject is of great importance for the navigation and control of the airspace of several countries.
Thus, ionospheric threat models, which determine the maximum ionospheric spatial decorrelation between the GBAS reference station and the aircraft approaching an airport, were developed or evaluated, mainly for the GBAS reference stations in the North American territory, which highlights the Conterminous United States (CONUS) Threat Model. In this area, the behavior of the ionosphere is more stable compared to Brazil, located in the equatorial region, characterized by adverse conditions, such as: Equatorial Ionization Anomaly (EIA), ionospheric bubbles, ionospheric irregularities, ionospheric scintillation and South Atlantic Anomaly (SAA).
The increasing number of domestic and international flights in Brazil since 2011, concomitantly with the implementation of a GBAS SLS-4000 by the Honeywell Company, through Department of Airspace Control (DECEA) at Rio de Janeiro International Airport (SBGL - ICAO code), aroused the need for studies on threat model for the Brazilian sector. Since the equipment is certified, in principle, for operation only in the United States, any user interested in using it must estimate the ionospheric parameters of the threat model for the region of interest, and verify if the values meet the established thresholds.
Among the integrity parameters transmitted by GBAS there is the standard deviation of the vertical ionospheric gradient, known as σvig , which is used, together with other parameters, to determine the Horizontal and Vertical Protection Levels (HPL/VPL) of the aircraft in the precise approach phase. With a unit in mm/km (or m/m), the threshold of 4 mm/km is sufficient to meet all ionospheric situations operating in the CONUS model, considering all Global Positioning System (GPS) satellites (Lee et al. 2007Lee, J., Pullen, S., Datta-Barua, S., Enge, P. 2007. Assessment of ionosphere spatial decorrelation for Global Positioning System-Based aircraft landing systems. J Aircr 44(5): 1662-1669.).
Thus, this work aims to present the estimation and analysis of HPL and VPL for precise approaches CAT-I and CAT-III at the Rio de Janeiro International Airport (SBGL), in order to compare them with the Horizontal Alert Limit (HAL) and Vertical Alert Limit (VAL) established by International Civil Aviation Organization (ICAO). For this purpose are used σvig values in real time, estimated with MoR_Ion_RT (software for ionospheric threat assessment for GBAS in Brazil). The software estimates σvig for each available GPS and Globalnaya Navigatsionnaya Sputnikovaya Sistema (GLONASS) satellite and distance intervals of 50 km (less than 100 km from Lee et al. 2007Lee, J., Pullen, S., Datta-Barua, S., Enge, P. 2007. Assessment of ionosphere spatial decorrelation for Global Positioning System-Based aircraft landing systems. J Aircr 44(5): 1662-1669.) between the GBAS located at the SBGL airport and aircraft.
2. Background
2.1 GBAS and Protection Levels
GBAS was developed for use in CAT-I precise approaches, with the possibility of contemplating CAT-II and CAT-III. Such approaches are performed by aircraft equipped with a GNSS receiver, which uses messages transmitted via Very High Frequency (VHF) from GBAS installed near an airport runway.
GBAS messages contain differential corrections for pseudorange (Type 1), integrity parameters (Type 2), and one or more sets of Final Approach Segment (FAS) data (Type 4). Differential pseudorange corrections are obtained using a set of reference stations (usually 4), equipped with single frequency receivers (L1), installed at known reference locations and using the DGNSS concept. It is noteworthy that the system uses only L1, because, for safety reasons, the use of the L2 carrier is not authorized by ICAO in air navigation. Note that the modernization of GPS allows minimizing the error introduced by the ionosphere because of the availability of the L5 signal by the satellites of the IIF block. Based on Circiu et al. (2014Circiu, M. S., Felux, M., Remi, P., Yi, L., Belabbas, B., Pullen, S. 2014. Evaluation of dual frequency GBAS performance using flight data. In: INTERNATIONAL TECHNICAL MEETING OF THE INSTITUTE OF NAVIGATION, San Diego. Proceedings … , San Diego, p. 645-656.), the use of L1 and L5 signals in GBAS may considerably improve the correction of the effects of the ionosphere through the ionosphere-free combination.
For GBAS to meet the navigation performance requirements established by the ICAO, that is, HPL < HAL and VPL < VAL (Figure 1), limits must be established in the variation of ionospheric errors between the approaching aircraft and the reference stations, in order to minimize the loss of availability (Datta-Barua et al. 2002Datta-Barua, S., Walter, T., Pullen, S., Luo, M., Blanch, J., Enge, P. 2002. Using WAAS ionospheric data to estimate LAAS short baseline gradients. In: ION 2002 NATIONAL TECHNICAL MEETING, Anaheim. Proceedings … , Anaheim, p. 523-530.).

Protection level and alert limit (Lee 2005Lee, J. 2005. GPS-Based aircraft landing systems with enhanced performance: beyond accuracy (Doctoral dissertation, Stanford University).).
In order to determine these limits, the configuration of the GBAS to be modeled is one in which the reference stations and the aircraft receiver simultaneously track a certain minimum number of satellites, whose signals are subject to delays due to the ionosphere. However, such delays are not the same when the lines of sight are different. In contrast, as the aircraft approaches ground stations, the difference between ionospheric errors tends to be reduced (Datta-Barua et al. 2002Datta-Barua, S., Walter, T., Pullen, S., Luo, M., Blanch, J., Enge, P. 2002. Using WAAS ionospheric data to estimate LAAS short baseline gradients. In: ION 2002 NATIONAL TECHNICAL MEETING, Anaheim. Proceedings … , Anaheim, p. 523-530.).
Faced with the problem, researchers from Stanford University developed an ionospheric threat model, named CONUS Threat Model, in order to estimate the maximum existing spatial decorrelation between the delay (error) provided by a satellite to a reference station and the signal delay from that same satellite to the aircraft receiver. This estimate is called ionospheric gradient (Datta-Barua et al. 2010Datta-Barua, S., Lee, J., Pullen, S., Luo, M., Ene, A., Qiu, D., Zhang, G., Enge, P. 2010. Ionospheric threat parameterization for local area Global-Positioning-System-Based aircraft landing systems. J Aircr 47(4): 1141-1151.).
2.2 CONUS Threat Model
In the CONUS Threat Model, the EIA and ionospheric irregularities are represented as an ionospheric front, which moves at a certain horizontal speed, providing ionospheric error gradients (Mayer et al. 2009Mayer, C., Belabbas, B., Jakowski, N., Meurer, M., Dunkel, W. 2009. Ionosphere threat space model assessment for GBAS. In: INTERNATIONAL TECHNICAL MEETING OF THE SATELLITE DIVISION OF THE INSTITUTE OF NAVIGATION, 22., Savannah. Proceedings … , Savannah, p. 1091-1099.). The representation of an ionospheric front is shown in Figure 2, with the model parameters being the ionospheric gradient, the speed and width of the front and the maximum value of Total Electron Content (TEC) or ionospheric delay.

The limits of the parameters are obtained from the processing of a set of data that includes days when there is high and low variability in the electronic density of the ionospheric layer. The results are presented as a function of the elevation angle of the satellites for the gradients, in terms of maximum and minimum values for speed and width and the maximum value of TEC (or ionospheric delay), with no temporal variation for the values.
The methodology for determining the parameters can be found, for example, in Pereira et al. (2017Pereira, V. A. S., Monico, J. F. G., Camargo, P. O. 2017. Procedimento geral para o desenvolvimento de modelo de risco ionosférico para GBAS e principais modelos existentes. In: IV SIMPÓSIO BRASILEIRO DE GEOMÁTICA E II JORNADAS LUSÓFONAS - CIÊNCIAS E TECNOLOGIAS DE INFORMAÇÃO GEOGRÁFICA, Presidente Prudente. Proceedings … , Presidente Prudente, p. 563-570.), Srinivas et al. (2014Srinivas, V. S., Sarma, A. D., Reddy, A. S., Reddy, D. K. 2014. Investigation of the effect of ionospheric gradients on GPS signals in the context of LAAS. Progr Electromagn Res 57: 191-205.), Bumrungkit et al. (2014Bumrungkit, A., Rungraengwajiake, S., Supnithi, P., Siansawasdi, N. 2014. Drift velocity estimation of ionospheric disturbance using GPS observations. In: JOINT INTERNATIONAL CONFERENCE ON INFORMATION AND COMMUNICATION TECHNOLOGY, ELECTRONIC AND ELECTRICAL ENGINEERING (JICTEE), 4., Chiang Rai. Proceedings … , Chaing Rai, p. 1-5.), Mayer et al. (2009Mayer, C., Belabbas, B., Jakowski, N., Meurer, M., Dunkel, W. 2009. Ionosphere threat space model assessment for GBAS. In: INTERNATIONAL TECHNICAL MEETING OF THE SATELLITE DIVISION OF THE INSTITUTE OF NAVIGATION, 22., Savannah. Proceedings … , Savannah, p. 1091-1099.) and Ene et al. (2005Ene, A., Qiu, D., Luo, M., Pullen, S., Enge, P. 2005. A comprehensive ionosphere storm data analysis method to support LAAS threat model development. In: ION 2005 NATIONAL TECHNICAL MEETING, San Diego. Proceedings …, San Diego, p. 110-130.).
To check if the limits of the threat model parameters can be used in a region, one of the existing possibilities is to use a dense network of stations for continuous monitoring of GNSS signals, since, among one of the model development alternatives, there is the station-pair method. In this method one station of the pair simulates a GBAS and the other an aircraft (Lee et al. 2007Lee, J., Pullen, S., Datta-Barua, S., Enge, P. 2007. Assessment of ionosphere spatial decorrelation for Global Positioning System-Based aircraft landing systems. J Aircr 44(5): 1662-1669.). Another possibility is the use of GNSS simulators, in which case prior knowledge of the ionospheric conditions in the GBAS region is necessary.
For the development of CONUS model were used GPS data (L1 and L2) of Continuously Operating Reference Station (CORS) for 10 days between the years 2000 and 2004. The limits and variations of the parameters are presented in Table 1 (Datta-Barua et al. 2010Datta-Barua, S., Lee, J., Pullen, S., Luo, M., Ene, A., Qiu, D., Zhang, G., Enge, P. 2010. Ionospheric threat parameterization for local area Global-Positioning-System-Based aircraft landing systems. J Aircr 47(4): 1141-1151.).
Limits and variations of CONUS Threat Model parameters. E means elevation of the satellite (Datta-Barua et al. 2010Datta-Barua, S., Lee, J., Pullen, S., Luo, M., Ene, A., Qiu, D., Zhang, G., Enge, P. 2010. Ionospheric threat parameterization for local area Global-Positioning-System-Based aircraft landing systems. J Aircr 47(4): 1141-1151.).
2.3 σvig Estimation
Kolb et al. (2005Kolb, P. F., Chen, X., Vollath, U. 2005. A new method to model the ionosphere across local area networks. In: INTERNATIONAL TECHNICAL MEETING OF THE SATELLITE DIVISION OF THE INSTITUTE OF NAVIGATION, 18., ION GNSS 2005, Long Beach. Proceedings … , Long Beach, p. 705-711.) and Datta-Barua et al. (2002Datta-Barua, S., Walter, T., Pullen, S., Luo, M., Blanch, J., Enge, P. 2002. Using WAAS ionospheric data to estimate LAAS short baseline gradients. In: ION 2002 NATIONAL TECHNICAL MEETING, Anaheim. Proceedings … , Anaheim, p. 523-530.), when analyzing vertical ionospheric gradients for Germany and U.S., respectively, obtained the value of 1 mm/km (1σ) for σvig in nominal days. However, this value is not rigorous enough to ensure that the protection levels meet air navigation requirements. The reason is due the method described for the calculation of the protection levels assumes zero mean and Gaussian distribution for the ionospheric spatial decorrelation, and the ionospheric gradients do not necessarily have zero mean and normal distribution. Thus, it is necessary that the value of σvig transmitted contemplates all ionospheric conditions (Lee et al. 2007Lee, J., Pullen, S., Datta-Barua, S., Enge, P. 2007. Assessment of ionosphere spatial decorrelation for Global Positioning System-Based aircraft landing systems. J Aircr 44(5): 1662-1669.).
Thus, Lee et al. (2007Lee, J., Pullen, S., Datta-Barua, S., Enge, P. 2007. Assessment of ionosphere spatial decorrelation for Global Positioning System-Based aircraft landing systems. J Aircr 44(5): 1662-1669.) developed a method for estimating the standard deviation of the vertical ionospheric gradient in a more rigorous way, called Sigma Overbounding Method. The method consists in the analysis of the Probability Density Functions (PDF) of normalized vertical ionospheric gradients, obtained for active and nominal ionospheric days, in order to obtain an inflation factor (f) that, when multiplying the Gaussian distribution 1σ, obtains a distribution that actually suits the actual distribution of the gradients.
The steps of the Sigma Overbounding Method are: the vertical gradients are divided into intervals (blocks) according to the distances of the stations that form the pairs, that is, in intervals of 0-50 km, 50-100 km, 100-150 km, 150-200 km, 200-250 km and others, for example; the mean (μvig ) and standard deviation (σvig ) of the vertical ionospheric gradients are then calculated for each interval and used to normalize the gradients of each block; thus, based on the PDF of the normalized vertical ionospheric gradients, the inflation factor (f) for each interval is determined. Finally, the inflated σvig (σvig_infla ) is calculated for each interval using (Lee et al. 2007Lee, J., Pullen, S., Datta-Barua, S., Enge, P. 2007. Assessment of ionosphere spatial decorrelation for Global Positioning System-Based aircraft landing systems. J Aircr 44(5): 1662-1669.):
Values of σvig_infla obtained for the CONUS Threat Model indicate that 4 mm/km is sufficient to meet all ionospheric conditions operating in the region (Lee et al. 2007Lee, J., Pullen, S., Datta-Barua, S., Enge, P. 2007. Assessment of ionosphere spatial decorrelation for Global Positioning System-Based aircraft landing systems. J Aircr 44(5): 1662-1669.).
2.4 HPL/VPL Estimation
The aircraft must estimate in real time the Protection Levels (PL), which are determined in order to meet the following requirement:
where the PL must overlap the true position error, which is unknown in real time, with a probability of (1 - α), coinciding with the integrity value of Table 2 for CAT-I, II and III operations.
Rewriting the equation of the pseudorange (P) of a given satellite (s) recorded by a receiver (r) in terms of the Cartesian geodetic coordinates (x, y, z) obtains (Monico 2008Monico, J. F. G. 2008. Posicionamento pelo GNSS: descrição, fundamentos e aplicações. São Paulo: Editora da UNESP.):
where c is the speed of light in a vacuum, dt r and dt s the errors of the receiver and satellite clocks in relation to GPS time, respectively, I r s , T r s , dm r s and Orb r s the errors due to the ionosphere, troposphere, multipath and satellite position, respectively, and νP the non-modeled systematic and random errors.
Replacing the term of the clock errors c(dt r - dt s ) in (3) by dt, and the errors due to the ionosphere, troposphere, multipath, satellite position and the non-modeled systematic and random errors by just ε, it has:
As N satellites are tracked by the receiver aircraft, so there will be N recorded pseudorange equation (s = 1, 2,..., N). To obtain the differential corrections in the pseudorange, the respective theoretical pseudoranges between the receiver and the N satellites must be calculated using the approximate geodetic coordinates (x r0 , y r0 , z r0 ) and the approximate errors of the receiver and satellite clocks (dt 0 ) (Lee 2005Lee, J. 2005. GPS-Based aircraft landing systems with enhanced performance: beyond accuracy (Doctoral dissertation, Stanford University).), as presented in (5):
Thus, realizing the difference between the pseudoranges contained in the observation file (P r s ) and the calculated (P r s 0 ), differential corrections (ΔPr s ) are obtained, whose matrix functional model is given by (Lee 2005Lee, J. 2005. GPS-Based aircraft landing systems with enhanced performance: beyond accuracy (Doctoral dissertation, Stanford University).):
where ΔPr s it is an N x 1 vector containing the differential pseudorange corrections for each satellite and A is the receiver-satellite design (Jacobian) matrix, consisting of N lines-of-sight vectors (L (N) ), appended by a column vector of ones due to the clock error (Lee 2005Lee, J. 2005. GPS-Based aircraft landing systems with enhanced performance: beyond accuracy (Doctoral dissertation, Stanford University).). An alternative form to obtain the elements of matrix A is presented by Srinivas et al. (2014Srinivas, V. S., Sarma, A. D., Reddy, A. S., Reddy, D. K. 2014. Investigation of the effect of ionospheric gradients on GPS signals in the context of LAAS. Progr Electromagn Res 57: 191-205.), as a function of azimuth (Az) and elevation (E) of each satellite in a local geodetic coordinate system, with origin at the aircraft receiver. The following matrix presents such elements:
Considering the vector containing the Cartesian coordinates of the aircraft receiver and the clock errors ([Δxr Δyr Δzr Δdt] T ) as an unknown factor, the solution is obtained by applying the adjustment of observations using the Least Squares Method, given by:
being W the diagonal weight matrix, of order N, of the pseudorange measures, since it is assumed that the measurement errors are not correlated and that they have Gaussian distribution (Lee 2005Lee, J. 2005. GPS-Based aircraft landing systems with enhanced performance: beyond accuracy (Doctoral dissertation, Stanford University).). The matrix W is determined by:
For each pseudorange measurement of each satellite (s), the following error model is assumed (Srinivas et al. 2014Srinivas, V. S., Sarma, A. D., Reddy, A. S., Reddy, D. K. 2014. Investigation of the effect of ionospheric gradients on GPS signals in the context of LAAS. Progr Electromagn Res 57: 191-205.; Lee 2005Lee, J. 2005. GPS-Based aircraft landing systems with enhanced performance: beyond accuracy (Doctoral dissertation, Stanford University).):
where the error due to the aircraft (σA ), given by equation (11), is determined from the noise of the receiver (σN ) and a specific multipath model (σM ), the errors due to the troposphere (σT ), equation (14), and the ionosphere (σI ), equation (15), estimated from residual errors, and the error due to the station (σG ) calculated using a multipath model and noise from the reference station receiver, from equation (17) (Lee 2005Lee, J. 2005. GPS-Based aircraft landing systems with enhanced performance: beyond accuracy (Doctoral dissertation, Stanford University).).
being:
where a 0 , a 1 and E c are the Aircraft Accuracy Designators (AAD).
σR being the refractivity uncertainty (dimensionless), h 0 the height of the tropospheric layer and Δh the height of the aircraft in relation to the GBAS reference stations, all transmitted in GBAS messages.
where F pp s consists of the obliquity factor, which converts from vertical to slant for a satellite (s), presented in equation (16), X aircraft the inclined distance between the aircraft and GBAS, τ the smoothing filter constant time (in general 100 seconds) and V aircraft the horizontal speed of the aircraft.
with R the mean radius of the Earth and h m the mean height of the ionospheric layer.
where M is the number of reference stations operating in GBAS and a 0 , a 1 , a 2 and E 0 are the Ground Accuracy Designator (GAD).
For simplification purposes, the projection matrix S (4 x N) is determined by (Lee 2005Lee, J. 2005. GPS-Based aircraft landing systems with enhanced performance: beyond accuracy (Doctoral dissertation, Stanford University).):
In this way, once all the adjustment vectors and matrices are defined, the standard deviations of the horizontal and vertical position errors (σHPE , σVPE ) are obtained from equations (19) and (20):
where S H (s) and S V (s) are the horizontal and vertical components of matrix S for a satellite (s), respectively. For component determinations, for example, the following operations are performed (Rowson et al. 1998Rowson, S., Van Dyke, K., Kline, P., Murphy, T., Hua, Q. 1998. Evaluation of LAAS availability with an enhanced GPS constellation. In: IEEE 1998 Position Location and Navigation Symposium. p. 501-509.):
where S 1 (s) , S 2 (s) and S 3 (s) correspond to the s th elements of the first, second and third lines of S, respectively, and θGPA (Glide Path Angle) the displacement angle for the final approach path, normally 3° (Srinivas et al. 2014Srinivas, V. S., Sarma, A. D., Reddy, A. S., Reddy, D. K. 2014. Investigation of the effect of ionospheric gradients on GPS signals in the context of LAAS. Progr Electromagn Res 57: 191-205.).
Assuming that the horizontal and vertical position errors have Gaussian distribution, the horizontal (HPL) and vertical (VPL) protection levels can then be calculated by equations (23) and (24) (Srinivas et al. 2014Srinivas, V. S., Sarma, A. D., Reddy, A. S., Reddy, D. K. 2014. Investigation of the effect of ionospheric gradients on GPS signals in the context of LAAS. Progr Electromagn Res 57: 191-205.; Lee 2005Lee, J. 2005. GPS-Based aircraft landing systems with enhanced performance: beyond accuracy (Doctoral dissertation, Stanford University).; Walter et al. 1997Walter, T., Enge, P., Hansen, A. 1997. A proposed integrity equation for WAAS MOPS. In: INTERNATIONAL TECHNICAL MEETING OF THE SATELLITE DIVISION OF THE INSTITUTE OF NAVIGATION, 10., Kansas City. Proceedings … , Kansas City, p. 475-484.):
where K ffmd (fault-free missed detection) is the quantile of a unit Gaussian distribution corresponding to α (Lee 2005Lee, J. 2005. GPS-Based aircraft landing systems with enhanced performance: beyond accuracy (Doctoral dissertation, Stanford University).). Rowson et al. (1998Rowson, S., Van Dyke, K., Kline, P., Murphy, T., Hua, Q. 1998. Evaluation of LAAS availability with an enhanced GPS constellation. In: IEEE 1998 Position Location and Navigation Symposium. p. 501-509.) also emphasize that K ffmd is a multiplier that represents the probability of detecting errors in the pseudorange; its value depending on the number of reference stations operating in the GBAS system and the type of flight operation. Table 3 shows the K ffmd values for CAT-I, II and III (Rowson et al. 1998Rowson, S., Van Dyke, K., Kline, P., Murphy, T., Hua, Q. 1998. Evaluation of LAAS availability with an enhanced GPS constellation. In: IEEE 1998 Position Location and Navigation Symposium. p. 501-509.).
Kffmd values for CAT-I, II and III (Rowson et al. 1998Rowson, S., Van Dyke, K., Kline, P., Murphy, T., Hua, Q. 1998. Evaluation of LAAS availability with an enhanced GPS constellation. In: IEEE 1998 Position Location and Navigation Symposium. p. 501-509.).
3. Development of Software for Ionospheric Threat Assessment for GBAS in Brazil (MoR_Ion_RT)
MoR_Ion_RT is software developed for real time ionospheric threat assessment for GBAS in Brazil (Pereira 2018Pereira, V. A. S. 2018. Investigation of GBAS usability in Brazil (Doctoral dissertation, Sao Paulo State University).). It is divided into four types of operations: initial, intermediate, final and in real time (Figure 3). It should be noted that the software was developed in C language and for the Windows operating system.

It is necessary to inform some initial configurations to run the software: airport for which the user wants to determine σvig , type of satellite constellation and carrier combination, elevation mask, processing period, timezone, and name of the computer’s personal folder.
In real time, pairs of stations are pre-established only for the following international airports: Brasilia (SBBR), Rio de Janeiro (SBGL), Sao Paulo (SBGR), Porto Alegre (SBPA), and Recife (SBRF). Regardless of the choice, the possible pairs of stations are defined a priori, considering a search radius of 500 km in relation to the airport’s location and a maximum distance of 250 km between pairs of stations.
Due to the impossibility of estimating the receiver’s Differential Code Bias (DCB) in real time using the technique proposed by Prol & Camargo (2014Prol, F. S., Camargo, P. O. 2014. Estimativa da tendência diferencial do código nos receptores GNSS. Bol Cienc Geod 20(4): 735-749.), since Ionosphere Map Exchange Format (IONEX) are provided in daily files and the DCB of satellites in monthly files, the following approach is applied in the software: the DCB of station receivers for 40 days before the current day are determined and the averages and the respective standard deviations are calculated. Thus, the average DCB whose deviations do not exceed one nanosecond are considered valid. Otherwise, the stations and, consequently, the pairs, are invalidated for the determination of the gradients.
The real time processing starts with the connection of the BKG NTRIP Client (BNC). In this step, a script is generated containing all connection parameters with the RBMC in Real Time - Internet Protocol (RBMC-IP) caster.
The Rate of Change of TEC (ROT) and the index of irregularities of the ionosphere ROTI (Pi et al. 1997Pi, X., Mannucci, A. J., Lindqwister, U. J., Ho, C. M. 1997. Monitoring of global ionospheric irregularities using the worldwide GPS network. Geophys Res Lett 24(18): 2283-2286.) are calculated concurrently with the estimates of the gradients, in order to assist the stages of automatic screening and automatic validation. The process of estimating the ROT and the ROTI index is the same as described by Pereira & Camargo (2017Pereira, V. A. S., Monico, J. F. G., Camargo, P. O. 2017. Procedimento geral para o desenvolvimento de modelo de risco ionosférico para GBAS e principais modelos existentes. In: IV SIMPÓSIO BRASILEIRO DE GEOMÁTICA E II JORNADAS LUSÓFONAS - CIÊNCIAS E TECNOLOGIAS DE INFORMAÇÃO GEOGRÁFICA, Presidente Prudente. Proceedings … , Presidente Prudente, p. 563-570.).
For automatic separation of gradients it is considered the threshold of 100 mm/km presented by Datta-Barua et al. (2010Datta-Barua, S., Lee, J., Pullen, S., Luo, M., Ene, A., Qiu, D., Zhang, G., Enge, P. 2010. Ionospheric threat parameterization for local area Global-Positioning-System-Based aircraft landing systems. J Aircr 47(4): 1141-1151.). Another screening operation is to exclude gradients whose rate of change in the ionospheric delay is less than 10 mm/s, a conservative value in relation to the 15 mm/s threshold adopted by Datta-Barua (2004). The justification for adopting this rate is that small-scale ionospheric irregularities and magnitudes can occur in Brazilian territory, as investigated by Pereira (2015Pereira, V. A. S. 2015. Monitoring of ionospheric irregularities and scintillation of GNSS signals: in real time and post-processed (Master thesis, Sao Paulo State University).).
Similar to the general gradient validation procedure (Datta-Barua et al. 2010Datta-Barua, S., Lee, J., Pullen, S., Luo, M., Ene, A., Qiu, D., Zhang, G., Enge, P. 2010. Ionospheric threat parameterization for local area Global-Positioning-System-Based aircraft landing systems. J Aircr 47(4): 1141-1151.), which consists of manually examining gradients in order to prove that the observed events are, in fact, anomalous ionospheric events, an automatic validation is proposed (Pereira 2018Pereira, V. A. S. 2018. Investigation of GBAS usability in Brazil (Doctoral dissertation, Sao Paulo State University).). For this, the ROTI ionospheric irregularity index is used and, if the value is higher than the high irregularity threshold, the gradient is validated.
Finally, three types of standard deviations of the ionospheric gradients are determined for each of the five distance blocks, as well as for the 0 to 250 km block, which includes all possible pairs: σvig without applying the validations (nv); after the application of the initial automatic validation (iv); and after the application of the final automatic validation (fv).
For illustration purpose, Figure 4 shows the screen capture of the software referring to SBBR airport, for the 12:41:09 and 12:41:10 UT (Universal Time) of February 19, 2018, considering the GPS and GLONASS satellites (L1/L2) and a 10° elevation mask. It should be noted that the standard deviations of the initial gradients (iv) and, consequently, the final gradients (fv) are null since there were no ionospheric disturbances during real time processing. Additionally, there are no σvig values for blocks 0-50 km and 100-150 km due to the presence of only a pair of stations in each block, which makes the standard deviation estimate unfeasible.

MoR_Ion_RT screen referring to SBBR airport, for GPS and GLONASS satellites (L1/L2), for two moments on February 19, 2018.
4. Results and Analysis of Protection Levels at SBGL
Using 17 stations (Table 4) of the Brazilian Network for Continuous Monitoring of the GNSS Systems (RBMC) (Fortes et al. 1998Fortes, L. P. S., Luz, R. T., Pereira, K. D., Costa, S. M. A., Blitzkow, D. 1998. The Brazilian Network for Continuous Monitoring of GPS (RBMC): Operation and Products. In: Brunner F.K. (eds) Advances in Positioning and Reference Frames. International Association of Geodesy Symposia, vol 118. Springer, Berlin, Heidelberg. ) available in the region of the Rio de Janeiro International Airport (22°48’S; 43°15’W), and considering 63 days between the years 2000 and 2016 (covering the apexes of solar cycles 23 and 24), a radius of search of 500 km in relation to the airport and a maximum distance of 250 km for the formation of the pairs of stations, firstly, the parameters of the CONUS model for the SBGL airport region were estimated during the autumn period, most affected season based on research by Pereira (2018Pereira, V. A. S. 2018. Investigation of GBAS usability in Brazil (Doctoral dissertation, Sao Paulo State University).), following the procedure described in Pereira et al. (2017)Pereira, V. A. S., Camargo, P. O. 2017. Brazilian active GNSS networks as systems for monitoring the ionosphere. GPS Solut 21(3): 1013-1025. DOI. 10.1007/s10291-016-0589-y.
https://doi.org/10.1007/s10291-016-0589-...
.
Such estimates considered only phase measurements in L1 and L2 of the GPS satellites and a 10° elevation mask. The ionospheric gradients of the 63 dates as a function of the elevation of the satellites are shown in Figure 5.

Ionospheric gradients as a function of the elevation of GPS satellites to SBGL airport. CTM line represents the limit of the CONUS Threat Model.
Analyzing Figure 5, during the autumn the estimates only do not meet the limit of the CONUS Threat Model when the elevation is between 10° and 37°, and the gradients that exceeded the threshold are less than 930 mm/km. Thus, the GBAS installed at the airport is likely to be suitable for use except when there is a large concentration of satellites in the aforementioned window.
In order to check the established restriction window, HPL and VPL estimates in real time and comparisons with the HAL and VAL values established by the ICAO were made. It was analyzed on April 23, 2018, from 23:12 to 23:48 UT as a study case. It is noteworthy that, during the period under study, the mean VTEC values were on the order of 9 TECU until 23:24 UT and 7 TECU until 23:48 UT, as shown in Figure 6.

For the approach at SBGL airport, the data of latitude, longitude, height and speed of a commercial flight carried out on March 12, 2018, which departed from Recife International Airport (SBRF), were used as example. Such data was obtained from the FlightAware website (https://flightaware.com). Figure 7 shows the flight path during the last 250 km.

Trajectory of the last 250 km of the flight (black) to SBGL airport (green). Stations (red) within a radius of 500 km in relation to the airport location and considering a maximum distance of 250 km between stations were used for the formation of pairs (blue).
Figure 8 illustrates the aircraft’s temporal variation in terms of distance to SBGL, height and speed of the last kilometers. It can be seen that the aircraft starts the approach procedure at around 23:24 UT, that is, 20 minutes or 150 km away from the airport, at which point the height and speed begin to be reduced.
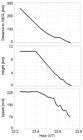
Distance, height and speed of the aircraft during the last 250 km of the flight to SBGL airport.
The σvig values for the GPS and GLONASS satellites were estimated in real time using the MoR_Ion_RT, considering the 17 RBMC-IP stations within a radius of 500 km in relation to the airport location (Table 4), and considering a maximum distance of 250 km between stations for the formation of pairs, as shown in Figure 7. Such values of standard deviations were obtained both for blocks of distances every 50 km, and independently the distance (called general), that is, considering all pairs of stations from 0 to 250 km.
The calculation of the pseudorange variance for each visible satellite, given by equation (10), was performed using errors due to the aircraft, the troposphere, the ionosphere and the ground station. It is noteworthy that for the error due to the tropospheric layer, the refractivity uncertainty and the height of the tropospheric layer were extracted from the GBAS Type 2 message, being equal to 15 and 12,900 m, respectively. Regarding the error due to the ionosphere, the mean radius of the Earth was considered to be 6,371 km and 350 km for the height of the ionospheric layer. The inclined distance between the aircraft and the GBAS station, for each instant of the flight, was obtained from the three-dimensional coordinates of the GBAS and the aircraft, and 100 seconds were used for the smoothing filter constant. For the error estimate due to the ground station, values were obtained considering four reference stations operating in the GBAS. Both for the error due to the aircraft and the station, the parameters GAD-A and B were considered.
Thus, based on the GBAS, aircraft and σvig data, an auxiliary software named SBGL_PL (Pereira 2018Pereira, V. A. S. 2018. Investigation of GBAS usability in Brazil (Doctoral dissertation, Sao Paulo State University).) was developed to calculate the horizontal and vertical protection levels, according to the sequence of equations presented in the subsection 2.4.
HPL and VPL values were obtained using only GPS satellites (G), only GLONASS satellites (R) and combining the two constellations (G+R). It was considered 3° for the GPA and 10° for the satellite elevation mask. In addition to the protection levels, the number of satellites available for each constellation is also shown.
Figure 9 presents the results considering a CAT-I approach, GAD-A parameters and σvig estimate in 50 km distance intervals. The graphs on the left side correspond to the results without the screening, while on the right side are the results of the exclusion of satellites that presented σvig greater than 4 mm/km. It is noteworthy that the protection levels are null for the 0-50 km block due to the lack of pairs of stations in this mileage range for the σvig estimate. Figure 10 shows the elevation of the GPS and GLONASS satellites available as a function of Universal Time, as well as the respective skyplots.

HPL, VPL and number of satellites available for the CAT-I approach at SBGL airport on April 23, 2018, considering GAD-A parameters, determination of σvig at 50 km intervals and with or without screening. GPS (blue), GLONASS (red) and combination of GPS and GLONASS (green).
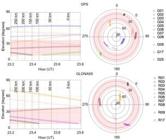
Elevation and skyplot of the GPS and GLONASS satellites available for the approach at SBGL airport on April 23, 2018. Restriction window in red.
From Figure 9 it can be seen that the HPL values fully satisfy the 40 m HAL for CAT-I. Regarding the vertical level, it is noted that, with the exception of the 100-150 km block and a few moments for the GPS satellites, the other values meet the 12 m threshold established by the ICAO.
Non-compliance with the VPL during the 100-150 km block is intrinsically related to the number of available satellites, five (minimum necessary to have one degree of freedom). This relationship between the increase in VPL and the decrease in the number of available satellites was also found by other investigations such as Krasuski & Ćwiklak (2018Krasuski, K., Ćwiklak, J., Grzesik, N. 2018. Accuracy Assessment of Aircraft Positioning by Using the DGLONASS Method in the GBAS System. Journal of Konbin 45(1): 97-124. DOI: https://doi.org/10.2478/jok-2018-0006
https://doi.org/10.2478/jok-2018-0006...
) and Krasuski et al. (2018)Krasuski, K., Ćwiklak, J. 2018. Application of the DGPS method for the precise positioning of an aircraft in air transport. Scientific Journal of Silesian University of Technology. Series Transport 98: 65-79. ISSN: 0209-3324.DOI: https://doi.org/10.20858/sjsutst.2018.98.7.
https://doi.org/10.20858/sjsutst.2018.98...
, who applied the DGNSS method for the precise positioning of an aircraft in southeastern Poland. In addition, the non-compliance with the vertical protection level of the GPS satellites during the 150-200 km and 200-250 km are due to the concentration of satellites with elevations between 10° and 37°, a restriction window imposed by the local threat model. From Figure 10, it is checked that from 23:27 UT, most satellites are outside the restriction range, resulting in the fulfillment of VPL values in relation to VAL.
An interesting fact to note is the joint use of GPS and GLONASS satellites, which considerably improve the protection values. This is due to the increase in redundancy of satellites, that is, the degree of freedom, which tends to overlap the degradation of the signals that few satellites can suffer on the ionospheric fronts.
Figure 9 also shows that the estimate of σvig in blocks of distances of 50 km more clearly reflects the variability in the behavior of the ionospheric layer, as opposed to a single value for the region surrounding the airport, which, in turn, implies more moderate behavior of the protection levels.
Regarding the screening technique, it should be used only when there is a high number of satellites available, because, otherwise, the excessive exclusion of satellites above the 4 mm/km threshold of CONUS Threat Model provides a worsening of spatial geometry, thus degrading the estimate of protection levels, as can be seen in the case of GLONASS satellites at 23:30 UT, which after the exclusion, only three satellites remained, making it impossible to estimate VPL and HPL. In contrast, using the two constellations concomitantly, it is observed that, after the screening, at least 5 satellites are available, which reflects in the VPL estimate in particular, practically meeting the CAT-I threshold.
In the situation of using the GAD-B parameters to approach the CAT-III type, the following levels are obtained, showed in Figure 11.
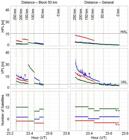
HPL, VPL and number of satellites available for the CAT-III approach at SBGL airport on April 23, 2018, considering GAD-B parameters, determination of σvig at 50 km intervals and without distinction of distance (general). GPS (blue), GLONASS (red) and combination of GPS and GLONASS (green).
As shown in Figure 11 it appears that at least in the last 75 km of distance the VPL values, for the combination of GPS and GLONASS satellites, satisfy the value of VAL (5.3 m), and that in the last 50 km the use of GPS satellites only also meets the threshold. These results indicate that the combined use of the constellations is an alternative to perform a CAT-III approach and precise landing at the Rio de Janeiro International Airport.
5. Conclusions
From the results obtained in the study case for HPL and VPL, it was found that it is possible to perform a CAT-I precise landing procedure with GAD-A parameters and four GBAS stations operating during the most affected season, autumn, at SBGL airport. For this the established restrictions must be respected (avoid satellites with elevations between 10° and 37°).
It was concluded that the screening technique should be used only when there is a high number of satellites available. Otherwise, the excessive exclusion of satellites above the 4 mm/km threshold of CONUS Threat Model provides a worsening of spatial geometry, thus degrading the estimate of protection levels.
On the other hand, it was found that the combined use of GPS and GLONASS satellites considerably improves the protection values. This is due to the increase in the redundancy of satellites tends to overlap the degradation of the signals that few satellites can suffer on the ionospheric fronts. This fact is corroborated by the experiment that allowed to perform a CAT-III procedure with GAD-B and four operating stations, using GPS and GLONASS satellites in concomitance.
It was also considered that the estimate of σvig in 50 km distance blocks translates more realistically the variability of the ionospheric layer behavior, as opposed to a single value for surrounding airport region that, in turn, implies behavior more moderate of protection levels.
As future work, it is recommended: to estimate and analyze HPL/VPL for other seasons, other aircraft routes and, if possible, other airports; and to consider the weighting of satellite observables in the stochastic model, as data screening can lead to a loss of redundancy in positioning.
ACKNOWLEDGEMENT
Our thanks go to the funding agencies CAPES (Coordination for the Improvement of Higher Education Personnel - process 88887.137186/2017-00), FAPESP (Sao Paulo Research Foundation - processes 2015/20522-7 and 2017/50115-0), and CNPq (National Council for Scientific and Technological Development - processes 465648/2014-2 and PQ 309832/2016-0) for financial support, to the Brazilian Institute of Geography and Statistics (IBGE), the CIGALA/CALIBRA projects, the Spatial Geodesy Laboratory (LGE), and International GNSS Service (IGS) for the supply of GNSS data, and to INCT GNSS-NavAer (National Institute of Science and Technology - GNSS Technology to Support Air Navigation) for the work environment.
REFERENCES
- Barros, D., Takahashi, H., Wrasse, C. M., Figueiredo, C. A. O. B. 2018. Characteristics of equatorial plasma bubbles observed by TEC map based on ground-based GNSS receivers over South America. Ann Geophys 36(1): 91-100.
- Bumrungkit, A., Rungraengwajiake, S., Supnithi, P., Siansawasdi, N. 2014. Drift velocity estimation of ionospheric disturbance using GPS observations. In: JOINT INTERNATIONAL CONFERENCE ON INFORMATION AND COMMUNICATION TECHNOLOGY, ELECTRONIC AND ELECTRICAL ENGINEERING (JICTEE), 4., Chiang Rai. Proceedings … , Chaing Rai, p. 1-5.
- Circiu, M. S., Felux, M., Remi, P., Yi, L., Belabbas, B., Pullen, S. 2014. Evaluation of dual frequency GBAS performance using flight data. In: INTERNATIONAL TECHNICAL MEETING OF THE INSTITUTE OF NAVIGATION, San Diego. Proceedings … , San Diego, p. 645-656.
- Datta-Barua, S., Lee, J., Pullen, S., Luo, M., Ene, A., Qiu, D., Zhang, G., Enge, P. 2010. Ionospheric threat parameterization for local area Global-Positioning-System-Based aircraft landing systems. J Aircr 47(4): 1141-1151.
- Datta-Barua, S., Walter, T., Pullen, S., Luo, M., Blanch, J., Enge, P. 2002. Using WAAS ionospheric data to estimate LAAS short baseline gradients. In: ION 2002 NATIONAL TECHNICAL MEETING, Anaheim. Proceedings … , Anaheim, p. 523-530.
- Ene, A., Qiu, D., Luo, M., Pullen, S., Enge, P. 2005. A comprehensive ionosphere storm data analysis method to support LAAS threat model development. In: ION 2005 NATIONAL TECHNICAL MEETING, San Diego. Proceedings …, San Diego, p. 110-130.
- Fortes, L. P. S., Luz, R. T., Pereira, K. D., Costa, S. M. A., Blitzkow, D. 1998. The Brazilian Network for Continuous Monitoring of GPS (RBMC): Operation and Products. In: Brunner F.K. (eds) Advances in Positioning and Reference Frames. International Association of Geodesy Symposia, vol 118. Springer, Berlin, Heidelberg.
- Hofmann-Wellenhof, B., Lichtenegger, H., Wasle, E. 2008. GNSS - Global Navigation Satellite Systems: GPS, GLONASS, Galileo, and more New York: Springer-Verlag Wien.
- Jung, S., Lee, J. 2012. Long-term ionospheric anomaly monitoring for Ground Based Augmentation Systems. Radio Sci 47(4): 1-12.
- Kim, J., Lee, S. W., Lee, H. K. 2014. An annual variation analysis of the ionospheric spatial gradient over a regional area for GNSS applications. Adv Space Res 54(3): 333-341.
- Kim, M., Choi, Y., Jun, H. S., Lee, J. 2015. GBAS ionospheric threat model assessment for category I operation in the Korean region. GPS Solut 19(3): 443-456.
- Kolb, P. F., Chen, X., Vollath, U. 2005. A new method to model the ionosphere across local area networks. In: INTERNATIONAL TECHNICAL MEETING OF THE SATELLITE DIVISION OF THE INSTITUTE OF NAVIGATION, 18., ION GNSS 2005, Long Beach. Proceedings … , Long Beach, p. 705-711.
- Krasuski, K., Ćwiklak, J. 2018. Application of the DGPS method for the precise positioning of an aircraft in air transport. Scientific Journal of Silesian University of Technology. Series Transport 98: 65-79. ISSN: 0209-3324.DOI: https://doi.org/10.20858/sjsutst.2018.98.7.
» https://doi.org/10.20858/sjsutst.2018.98.7. - Krasuski, K., Ćwiklak, J., Grzesik, N. 2018. Accuracy Assessment of Aircraft Positioning by Using the DGLONASS Method in the GBAS System. Journal of Konbin 45(1): 97-124. DOI: https://doi.org/10.2478/jok-2018-0006
» https://doi.org/10.2478/jok-2018-0006 - Lee, J. 2005. GPS-Based aircraft landing systems with enhanced performance: beyond accuracy (Doctoral dissertation, Stanford University).
- Lee, J., Datta-Barua, S., Zhang, G., Pullen, S., Enge, P. 2011a. Observations of low-elevation ionospheric anomalies for Ground-Based Augmentation of GNSS. Radio Sci 46(6): 1-11.
- Lee, J., Pullen, S., Datta-Barua, S., Enge, P. 2007. Assessment of ionosphere spatial decorrelation for Global Positioning System-Based aircraft landing systems. J Aircr 44(5): 1662-1669.
- Lee, J., Seo, J., Park, Y. S., Pullen, S., Enge, P. 2011b. Ionospheric threat mitigation by geometry screening in Ground-Based Augmentation Systems. J Aircr 48(4): 1422-1433.
- Luo, M., Pullen, S., Datta-Barua, S., Zhang, G., Walter, T., Enge, P. 2005. LAAS study of slow-moving ionosphere anomalies and their potential impacts. In: INTERNATIONAL TECHNICAL MEETING OF THE SATELLITE DIVISION OF THE INSTITUTE OF NAVIGATION, 18., ION GNSS 2005, Long Beach. Proceedings … , Long Beach, p. 2337-2349.
- Luo, M., Pullen, S., Dennis, J., Konno, H., Xie, G., Walter, T., Enge, P., Datta-Barua, S., Dehel, T. 2003. LAAS ionosphere spatial gradient threat model and impact of LGF and airborne monitoring. In: INTERNATIONAL TECHNICAL MEETING OF THE SATELLITE DIVISION OF THE INSTITUTE OF NAVIGATION ION GPS/GNSS, 16., Portland. Proceedings…, Portland.
- Mayer, C., Belabbas, B., Jakowski, N., Meurer, M., Dunkel, W. 2009. Ionosphere threat space model assessment for GBAS. In: INTERNATIONAL TECHNICAL MEETING OF THE SATELLITE DIVISION OF THE INSTITUTE OF NAVIGATION, 22., Savannah. Proceedings … , Savannah, p. 1091-1099.
- Monico, J. F. G. 2008. Posicionamento pelo GNSS: descrição, fundamentos e aplicações São Paulo: Editora da UNESP.
- Pereira, V. A. S. 2015. Monitoring of ionospheric irregularities and scintillation of GNSS signals: in real time and post-processed (Master thesis, Sao Paulo State University).
- Pereira, V. A. S. 2018. Investigation of GBAS usability in Brazil (Doctoral dissertation, Sao Paulo State University).
- Pereira, V. A. S., Camargo, P. O. 2017. Brazilian active GNSS networks as systems for monitoring the ionosphere. GPS Solut 21(3): 1013-1025. DOI. 10.1007/s10291-016-0589-y.
» https://doi.org/10.1007/s10291-016-0589-y - Pereira, V. A. S., Monico, J. F. G., Camargo, P. O. 2017. Procedimento geral para o desenvolvimento de modelo de risco ionosférico para GBAS e principais modelos existentes. In: IV SIMPÓSIO BRASILEIRO DE GEOMÁTICA E II JORNADAS LUSÓFONAS - CIÊNCIAS E TECNOLOGIAS DE INFORMAÇÃO GEOGRÁFICA, Presidente Prudente. Proceedings … , Presidente Prudente, p. 563-570.
- Pi, X., Mannucci, A. J., Lindqwister, U. J., Ho, C. M. 1997. Monitoring of global ionospheric irregularities using the worldwide GPS network. Geophys Res Lett 24(18): 2283-2286.
- Prol, F. S., Camargo, P. O. 2014. Estimativa da tendência diferencial do código nos receptores GNSS. Bol Cienc Geod 20(4): 735-749.
- Pullen, S., Park, Y. S., Enge, P. 2009. Impact and mitigation of ionospheric anomalies on Ground-Based Augmentation of GNSS. Radio Sci 44(1).
- Rowson, S., Van Dyke, K., Kline, P., Murphy, T., Hua, Q. 1998. Evaluation of LAAS availability with an enhanced GPS constellation. In: IEEE 1998 Position Location and Navigation Symposium p. 501-509.
- Sánchez-Naranjo, S., Rincón, W., Ramos-Pollán, R., González, F. A., Soley, S. 2017. A comprehensive assessment of ionospheric gradientes observed in Ecuador during 2013 and 2014 for ground based augmentation systems. Adv Space Res 59(8): 1992-2006.
- Srinivas, V. S., Sarma, A. D., Reddy, A. S., Reddy, D. K. 2014. Investigation of the effect of ionospheric gradients on GPS signals in the context of LAAS. Progr Electromagn Res 57: 191-205.
- Walter, T., Enge, P., Hansen, A. 1997. A proposed integrity equation for WAAS MOPS. In: INTERNATIONAL TECHNICAL MEETING OF THE SATELLITE DIVISION OF THE INSTITUTE OF NAVIGATION, 10., Kansas City. Proceedings … , Kansas City, p. 475-484.
- Wang, Z., Macabiau, C., Zhang, J., Escher, A. C. 2014. Prediction and analysis of GBAS integrity monitoring availability at LinZhi airport. GPS Solut 18(1): 27-40.
- Yoon, M., Lee, J. 2014. Medium-scale traveling ionospheric disturbances in the Korean region on 10 November 2004: Potential impact on GPS-Based Navigation Systems. Space Weather 12(4): 173-186.
Publication Dates
-
Publication in this collection
16 Apr 2021 -
Date of issue
2021
History
-
Received
22 June 2020 -
Accepted
08 Mar 2021


