
Abstract:
In this article, we present a framework to collect and represent people’s emotions, considering the urban mobility context of Curitiba. As a procedure, we have interviewed individuals during an intermodal challenge. The participants have described their experiences of urban mobility while using different transport modes. We have we used emojis as graphic symbols representing emotional data, once it is a modern language widely incorporated in everyday life as well as evokes a natural emotional association with the data we collected. We built an online geoinformation solution for visualising the emotional phenomenon. As a result, we found that the proposed methodology captures environmental factors as well as specific urban features triggering positive and negative/neutral emotions. Therefore, we validated the methodology of collaborative emotional mapping through volunteered geographic information, collecting and representing emotions on maps through emojis. Thus, here we argue this is a valid way to represent emotions and incorporate a modern language to maps. Based on the results and broader literature, we affirm this is a valuable alternative to increase knowledge about cities, once mapping emotions could assist urban planners in identifying variables, generating positive and negative feelings over the city space, which drives urban planning within a citizen-centred perspective.
Keywords:
Emotional Maps; Emojis; Urban Mobility; VGI; Collaborative mapping
1. Introduction
Large cities are complex urban spaces where hundreds of thousands of people live and build their socioeconomic relations (Rodrigue, Comtois and Slack 2016Rodrigue, J. P., Comtois, C. and Slack, B. 2016. The Geography of Transport Systems. 3rd ed. New York: Routledge. doi: 10.4324/9781315618159.
https://doi.org/10.4324/9781315618159...
). These complex spaces have been on the focus of researchers because they produce such huge impacts on the Earth System dynamics (Seitzinger et al. 2012Seitzinger, S. P. et al. 2012. Planetary stewardship in an urbanising world: Beyond city limits. Ambio, 41(8), pp. 787-794. doi: 10.1007/s13280-012-0353-7.
https://doi.org/10.1007/s13280-012-0353-...
). In fact, the rise of large cities is a phenomenon associated with population growth, observed since the middle of the 20th century (Gakenheimer 1999Gakenheimer, R. 1999. Urban mobility in the developing world. Transportation Research Part A: Policy and Practice. Elsevier Science Ltd, 33(7-8), pp. 671-689. doi: 10.1016/S0965-8564(99)00005-1.
https://doi.org/10.1016/S0965-8564(99)00...
; Cohen 2006Cohen, B. 2006. Urbanisation in developing countries: Current trends, future projections, and key challenges for sustainability. Technology in Society, Elsevier Ltd, 28(1-2), pp. 63-80. doi: 10.1016/j.techsoc.2005.10.005.
https://doi.org/10.1016/j.techsoc.2005.1...
; Montgomery 2008Montgomery, M. R. 2008. The urban transformation of the developing world. Science, 319(5864), pp. 761-764. doi: 10.1126/science.1153012.
https://doi.org/10.1126/science.1153012...
; Wang et al. 2012Wang, H. et al. 2012. Global urbanisation research from 1991 to 2009: A systematic research review. Landscape and Urban Planning. Elsevier, 104(3-4), pp. 299-309. doi: 10.1016/j.landurbplan.2011.11.006.
https://doi.org/10.1016/j.landurbplan.20...
). In the literature, both phenomena are connected to subjects such as climate change, food security issues, deforestation, and decreased quality of life (Godfray et al. 2010Godfray, H. C. J. et al. 2010. Food Security: The Challenge of Feeding 9 Billion People. Science, 327(5967), pp. 812-818. doi: 10.1126/science.1185383.
https://doi.org/10.1126/science.1185383...
; Higgins and Campanera 2011Higgins, P. Campanera, J. M. 2011. (Sustainable) quality of life in English city locations. Cities, 28(4), pp. 209-299. doi: 10.1016/j.cities.2011.02.005.
https://doi.org/10.1016/j.cities.2011.02...
; de Jong 2014de Jong, W. 2014. Climate change and deforestation: The evolution of an intersecting policy domain. Environmental Science & Policy, Elsevier, 35, pp. 1-11. doi: 10.1016/J.ENVSCI.2013.06.001.
https://doi.org/10.1016/J.ENVSCI.2013.06...
).
During the last decades, medium and large cities in developing countries have experienced a fast mode of urban growth (Cohen 2006Cohen, B. 2006. Urbanisation in developing countries: Current trends, future projections, and key challenges for sustainability. Technology in Society, Elsevier Ltd, 28(1-2), pp. 63-80. doi: 10.1016/j.techsoc.2005.10.005.
https://doi.org/10.1016/j.techsoc.2005.1...
; Eckert and Kohler 2014Eckert, S. and Kohler, S. 2014. Urbanisation and health in developing countries: a systematic review., World health & population. doi: 10.12927/whp.2014.23722.
https://doi.org/10.12927/whp.2014.23722...
). Particularly in these countries, it is noticeable that rapid growth was not accompanied by well-established policies, which led to adverse urban land management outcomes (Estes and Mooneyhan 1994Estes, J. E. Mooneyhan, D. W. 1994. Of maps and myths, Photogrammetric Engineering & Remote Sensing, 60(5), pp. 517-524.; Bianchini 2006Bianchini, F. A. 2006. Vila Torres - Curitiba/PR: Os espaços de representação e as relações de poder. Dissertation. Federal University of Paraná.; Banister 2008Banister, D. 2008. The sustainable mobility paradigm. Transport Policy, 15(2), pp. 73-80. doi: 10.1016/j.tranpol.2007.10.005.
https://doi.org/10.1016/j.tranpol.2007.1...
; Hickman, Hall and Banister 2013Hickman, R., Hall, P. Banister, D. 2013. Planning more for sustainable mobility. Journal of Transport Geography . 33, pp. 210-219. doi: 10.1016/j.jtrangeo.2013.07.004.
https://doi.org/10.1016/j.jtrangeo.2013....
; DeVylder et al. 2018DeVylder, J. E. et al. 2018. Association of urbanicity with psychosis in low- and middle-income countries. JAMA Psychiatry. American Medical Association, 75(7), pp. 678-686. doi: 10.1001/jamapsychiatry.2018.0577.
https://doi.org/10.1001/jamapsychiatry.2...
; Mohan, Tiwari and Sivaramakrishna 2019Mohan, D., Tiwari, G. Sivaramakrishna, K. C. 2019. Urban mobility. ed. 2019. Sustainable Approaches to Urban Transport. Boca Raton: CRC Press. Ch. 7. doi: 10.1201/9781351004862-7.
https://doi.org/10.1201/9781351004862-7...
). Consequently, the large cities in developing countries have been in such a chaotic scenario, notably in terms of public health management, environmental protection, quality of life, and urban mobility (Cohen 2006Cohen, B. 2006. Urbanisation in developing countries: Current trends, future projections, and key challenges for sustainability. Technology in Society, Elsevier Ltd, 28(1-2), pp. 63-80. doi: 10.1016/j.techsoc.2005.10.005.
https://doi.org/10.1016/j.techsoc.2005.1...
; Montgomery 2008Montgomery, M. R. 2008. The urban transformation of the developing world. Science, 319(5864), pp. 761-764. doi: 10.1126/science.1153012.
https://doi.org/10.1126/science.1153012...
; Eckert and Kohler 2014Eckert, S. and Kohler, S. 2014. Urbanisation and health in developing countries: a systematic review., World health & population. doi: 10.12927/whp.2014.23722.
https://doi.org/10.12927/whp.2014.23722...
).
Given that context, people living in large cities in developing countries are experiencing slow traffic flows, due to the lack of public transport investments as well as the preference for using vehicles powered by fossil fuels (Gössling 2016Gössling, S. 2016. Urban transport justice. Journal of Transport Geography, 54, pp. 1-9. doi: 10.1016/j.jtrangeo.2016.05.002.
https://doi.org/10.1016/j.jtrangeo.2016....
; Rodrigue, Comtois and Slack 2016Rodrigue, J. P., Comtois, C. and Slack, B. 2016. The Geography of Transport Systems. 3rd ed. New York: Routledge. doi: 10.4324/9781315618159.
https://doi.org/10.4324/9781315618159...
). Therefore, urban mobility is a subject matter of several research works, particularly in large cities in developing countries (Gakenheimer 1999Gakenheimer, R. 1999. Urban mobility in the developing world. Transportation Research Part A: Policy and Practice. Elsevier Science Ltd, 33(7-8), pp. 671-689. doi: 10.1016/S0965-8564(99)00005-1.
https://doi.org/10.1016/S0965-8564(99)00...
; Cohen 2006Cohen, B. 2006. Urbanisation in developing countries: Current trends, future projections, and key challenges for sustainability. Technology in Society, Elsevier Ltd, 28(1-2), pp. 63-80. doi: 10.1016/j.techsoc.2005.10.005.
https://doi.org/10.1016/j.techsoc.2005.1...
; Eckert and Kohler 2014Eckert, S. and Kohler, S. 2014. Urbanisation and health in developing countries: a systematic review., World health & population. doi: 10.12927/whp.2014.23722.
https://doi.org/10.12927/whp.2014.23722...
; Rodrigue, Comtois and Slack 2016Rodrigue, J. P., Comtois, C. and Slack, B. 2016. The Geography of Transport Systems. 3rd ed. New York: Routledge. doi: 10.4324/9781315618159.
https://doi.org/10.4324/9781315618159...
). Urban mobility describes people’s movements within the city space and is “linked to specific urban activities and their land use” (Rodrigue, Comtois and Slack 2016Rodrigue, J. P., Comtois, C. and Slack, B. 2016. The Geography of Transport Systems. 3rd ed. New York: Routledge. doi: 10.4324/9781315618159.
https://doi.org/10.4324/9781315618159...
). Population growth has made large cities slow in terms of mobility. That scenario could change people’s feelings about the urban space, mostly encouraging negative emotions (van den Berg, Hartig and Staats 2007van den Berg, A. E., Hartig, T. Staats, H . 2007. Preference for nature in urbanised societies: Stress, restoration, and the pursuit of sustainability. Journal of Social Issues. John Wiley & Sons, Ltd, 63(1), pp. 79-96. doi: 10.1111/j.1540-4560.2007.00497.x.
https://doi.org/10.1111/j.1540-4560.2007...
; McKenzie, Murray and Booth 2013McKenzie, K., Murray, A. Booth, T. 2013. Do urban environments increase the risk of anxiety, depression and psychosis? An epidemiological study. Journal of Affective Disorders, Elsevier B.V., 150(3), pp. 1019-1024. doi: 10.1016/j.jad.2013.05.032.
https://doi.org/10.1016/j.jad.2013.05.03...
; Shoval, Schvimer and Tamir 2018Shoval, N., Schvimer, Y. Tamir, M. 2018. Tracking technologies and urban analysis: Adding the emotional dimension. Cities , 72, pp. 34-42. doi: 10.1016/j.cities.2017.08.005.
https://doi.org/10.1016/j.cities.2017.08...
; Fett, Lemmers-Jansen and Krabbendam 2019Fett, A. K. J., Lemmers-Jansen, I. L. J. Krabbendam, L. 2019. Psychosis and urbanicity: A review of the recent literature from epidemiology to neurourbanism. Current Opinion in Psychiatry, Lippincott Williams and Wilkins, 32(3), pp. 232-241. doi: 10.1097/YCO.0000000000000486.
https://doi.org/10.1097/YCO.000000000000...
).
The rise of earth observation technologies (EOs) has enabled scientists to carefully watch the dynamics of large cities (Calabrese et al. 2013Calabrese, F. et al. 2013. Understanding individual mobility patterns from urban sensing data: A mobile phone trace example. Transportation Research Part C: Emerging Technologies, 26, pp. 301-313. doi: 10.1016/j.trc.2012.09.009.
https://doi.org/10.1016/j.trc.2012.09.00...
; Ferster and Coops 2013Ferster, C. J. and Coops, N. C. 2013. A review of earth observation using mobile personal communication devices’, Computers & Geosciences. Pergamon, 51, pp. 339-349. doi: 10.1016/J.CAGEO.2012.09.009.
https://doi.org/10.1016/J.CAGEO.2012.09....
). In the realm of geospatial science, that sort of observation had become closer to the citizen point of view when the web 2.0 technologies enabled individuals without education in Cartography and Geographic Information System (GIS) to collect data, the so-called neogeography made by “citizens as sensors” (Goodchild 2007Goodchild, M. F. 2007. Citizens as sensors: the world of volunteered geography. GeoJournal, Springer Netherlands, 69(4), pp. 211-221. doi: 10.1007/s10708-007-9111-y.
https://doi.org/10.1007/s10708-007-9111-...
). The fast development of technologies serving the purpose of mapping the world favoured populated geographic regions. The more people living at someplace, the greater are the possibilities of having individuals engaged in mapping it (Haklay, Singleton and Parker 2008Haklay, M., Singleton, A. Parker, C. 2008. Web Mapping 2.0: The Neogeography of the GeoWeb. Geography Compass, 2(6), pp. 2011-2039. doi: 10.1111/j.1749-8198.2008.00167.
https://doi.org/10.1111/j.1749-8198.2008...
; Heipke 2010Heipke, C. 2010. Crowdsourcing geospatial data. ISPRS Journal of Photogrammetry and Remote Sensing . Elsevier, 65(6), pp. 550-557. doi: 10.1016/J.ISPRSJPRS.2010.06.005.
https://doi.org/10.1016/J.ISPRSJPRS.2010...
; Haklay 2013Haklay, M. M. 2013. Neogeography and the delusion of democratisation. Environment and Planning A, 45(1), pp. 55-69. doi: 10.1068/a45184.
https://doi.org/10.1068/a45184...
; Camboim, Bravo and Sluter 2015Camboim, S. P., Bravo, J. V. M. Sluter, C. R. 2015. An investigation into the completeness of, and the updates to, OpenStreetMap data in a heterogeneous area in Brazil. ISPRS International Journal of Geo-Information, 4(3), pp. 1366-1388. doi: 10.3390/ijgi4031366.
https://doi.org/10.3390/ijgi4031366...
; Fritz, Fonte and See 2017Fritz, S., Fonte, C. See, L. 2017. The Role of Citizen Science in Earth Observation. Remote Sensing. Multidisciplinary Digital Publishing Institute, 9(4), p. 357. doi: 10.3390/rs9040357.
https://doi.org/10.3390/rs9040357...
).
Within that new context, people have rapidly mapped dozens of places around the world, within Volunteered Geographic Information platforms such as OpenStreetMap. Therefore, the volunteered geographic information (VGI) enabled the growth of citizen’s engagement in urban development planning, within the Citizen-Centered Perspective (Fathullah and Willis 2018Fathullah, A. and Willis, K. 2018. Engaging the Senses: The Potential of Emotional Data for Participation in Urban Planning,. MDPI AG, 2(4), p. 98. doi: 10.3390/urbansci2040098.
https://doi.org/10.3390/urbansci2040098...
; Pánek 2019Pánek, J. 2019. Emotional maps: Participatory crowdsourcing of citizens’ perceptions of their urban environment. Cartographic Perspectives , 2018(91), pp. 17-29. doi: 10.14714/CP91.1419.
https://doi.org/10.14714/CP91.1419...
). Notably, VGI has changed the way the researchers observe the world, especially urban systems, because they now could see places through the eyes of citizens (Goodchild 2007Goodchild, M. F. 2007. Citizens as sensors: the world of volunteered geography. GeoJournal, Springer Netherlands, 69(4), pp. 211-221. doi: 10.1007/s10708-007-9111-y.
https://doi.org/10.1007/s10708-007-9111-...
; Rahmatizadeh, Rajabifard and Kalantari 2016Rahmatizadeh, S., Rajabifard, A. Kalantari, M. 2016. A conceptual framework for utilising VGI in land administration. Land Use Policy, Pergamon, 56, pp. 81-89. doi: 10.1016/J.LANDUSEPOL.2016.04.027.
https://doi.org/10.1016/J.LANDUSEPOL.201...
; See et al. 2016See, L. et al. 2016 Crowdsourcing, Citizen Science or Volunteered Geographic Information? The Current State of Crowdsourced Geographic Information. ISPRS International Journal of Geo-Information . Multidisciplinary Digital Publishing Institute, 5(5), p. 55. doi: 10.3390/ijgi5050055.
https://doi.org/10.3390/ijgi5050055...
; Bechtel et al. 2017Bechtel, B. et al. 2017. Quality of Crowdsourced Data on Urban Morphology -The Human Influence Experiment (HUMINEX). Urban Science, 1(2), doi: 10.3390/urbansci1020015.
https://doi.org/10.3390/urbansci1020015...
). Since then, scientists have been interested in mapping people’s emotions throughout the space with VGI applications, considering an extensive range of purposes (Fathullah and Willis 2018Fathullah, A. and Willis, K. 2018. Engaging the Senses: The Potential of Emotional Data for Participation in Urban Planning,. MDPI AG, 2(4), p. 98. doi: 10.3390/urbansci2040098.
https://doi.org/10.3390/urbansci2040098...
; Shoval, Schvimer and Tamir 2018Shoval, N., Schvimer, Y. Tamir, M. 2018. Tracking technologies and urban analysis: Adding the emotional dimension. Cities , 72, pp. 34-42. doi: 10.1016/j.cities.2017.08.005.
https://doi.org/10.1016/j.cities.2017.08...
; Caquard and Griffin 2019Caquard, S. Griffin, A. L. 2019. Mapping emotional cartography. Cartographic Perspectives. 4, pp. 4-16. doi: 10.14714/CP91.1551.
https://doi.org/10.14714/CP91.1551...
).
It is not new that emotions have been the focus of researchers from fields like Psychology, Geography and Cartography (Caquard and Griffin 2019Caquard, S. Griffin, A. L. 2019. Mapping emotional cartography. Cartographic Perspectives. 4, pp. 4-16. doi: 10.14714/CP91.1551.
https://doi.org/10.14714/CP91.1551...
). For psychologists, determining how people feel in specific contexts could be more interesting than the purely geographic focus given by geographers and cartographers, whose interest lies in observing the emotional phenomenon distribution over space and time (Caquard and Griffin 2019Caquard, S. Griffin, A. L. 2019. Mapping emotional cartography. Cartographic Perspectives. 4, pp. 4-16. doi: 10.14714/CP91.1551.
https://doi.org/10.14714/CP91.1551...
). Also, to think about emotions over space is not a new issue in geographic studies. Tuan (1974Tuan, Y. F. 1974. Topophilia: A Study of Environmental Perceptions, Attitudes, and Values. New York: Columbia University Press.) explained that the process of mapping emotions occurs according to the emotional bond of the individual generating information about the explored environment. In this sense, the integration of emotions with the participation of citizens in the field of urban planning, allows public managers to improve their understanding of the relationship between the population and urban spaces (Shoval, Schvimer and Tamir 2018Shoval, N., Schvimer, Y. Tamir, M. 2018. Tracking technologies and urban analysis: Adding the emotional dimension. Cities , 72, pp. 34-42. doi: 10.1016/j.cities.2017.08.005.
https://doi.org/10.1016/j.cities.2017.08...
). Therefore, the emotions experienced in certain portions of the geographic space could be a valuable input for creating urban planning policies, represented through the “emotional maps” (Mody, Willis and Kerstein 2009Mody, R. N., Willis, K. S. Kerstein, R. 2009. WiMo: Location-based emotion tagging. Proceedings of the 8th International Conference on Mobile and Ubiquitous Multimedia, MUM 2009. pp. 22-25. doi: 10.1145/1658550.1658564.
https://doi.org/10.1145/1658550.1658564...
; Griffin and McQuoid 2012Griffin, A.L. McQuoid, J. 2012. At the Intersection of Maps and Emotion: The Challenge of Spatially Representing Experience. Kartographische Nachrichten, 6, pp. 291-299.).
Nowadays, it is noticeable there are several interesting applications in the realm of emotional cartography. As we stated before, collecting geographic data about the emotional response of individuals in cities could benefit the development of urban planning policies in agreement with the people’s needs. These emotional data could be collected or measured using technical sensors (bio-sensing), self-reports who provide people’ subjective observations or crowdsourcing, and social media information (Zeile et al. 2015Zeile, P. Resch, B. Summa, A. Sagl, G. Exner, J. P. 2015. Urban emotions - Geo-semantic emotion extraction from technical sensors, human sensors and crowdsourced data. In Progress in location-based services 2014. pp. 199-212. Springer, Cham.; Klettner et al. 2013Klettner, S. Huang, H. Schmidt, M. Gartner, G. 2013. Crowdsourcing affective responses to space. Kartographische Nachrichten , 63, pp. 66-73. ).
For example, the project “Bio-Mapping” measured the Galvanic Skin Response associated with a Global Positioning System (GPS) to produce an Emotional Mapping based in the participant’s arousal in the paths taken. In that project, the emotion was mapped according to the participant’s interpretation of what has triggered the emotion response (Nold 2009Nold, C. 2009. Introduction: Emotional Cartography, Technologies of the Self [pdf] London: Softhook. Available at: <http://emotionalcartography.net/EmotionalCartographyLow.pdf>
http://emotionalcartography.net/Emotiona...
). The “Mappiness” is another example of research work that uses crowdsourcing methods for mapping citizens’ emotions. That project is settled in the United Kingdom and is based on a smartphone application that allows people to collect and disseminate data related to the happiness felt by passersby in British cities (MacKerron and Mourato 2020MacKerron, G. Mourato, S. 2020. Mappiness: natural environments and in-the-moment happiness. In: Handbook on Wellbeing, Happiness and the Environment: Edward Elgar Publishing, pp. 266-282. Ch. 4. doi: 10.4337/9781788119344.00022.
https://doi.org/10.4337/9781788119344.00...
). Similarly, the “EmoMap” project gathers the people’s affective response to model and develops pedestrian routes, called “AffectRoutes, providing data to smart location-based services (LBS) (Huang et al. 2014Huang, H.; Klettner, S.; Schmidt, M.; Gartner, G.; Leitinger, S.; Wagner, A.; Steinmann, R. 2014. AffectRoute-considering people’s affective responses to environments for enhancing route-planning services. International Journal of Geographical Information Science, 28(12), pp. 2456-2473.). Other using data from social media (Twitter, Facebook, Instagram) to produce emotional maps are from Mislove et al. (2010Mislove, A. Lehmann, S. Ahn, Y.-Y. Onnela, J.-P. Rosenquist, J.N. 2010. Pulse of the nation: U.S. mood throughout the day, as inferred from Twitter. [online] (updated 2010) Available at: <Available at: http://www.ccs.neu.edu/home/amislove/twittermood/ >. [Accessed 13 October 2020]
http://www.ccs.neu.edu/home/amislove/twi...
), who mapped the variation mood throughout the day in US at a scale of “Less Happy” and “More Happy”, and Oliveira and Painho (2015)De Oliveira, T. H. M. Painho, M. 2015. Emotion & stress mapping: Assembling an ambient geographic information-based methodology in order to understand smart cities. In: 2015 10th Iberian Conference on Information Systems and Technologies (CISTI), pp.1-4., which aims to map the geo-tagged data related with people’s perception and feelings regarding Lisbon (Portugal).
Additionally, it is noticeable that there are several ways to represent emotions on maps, applying different graphic variables for different contexts. For example, there are solutions with lines (Pánek and Benediktsson 2016Pánek, J. Benediktsson, K. 2016. Emotional mapping and its participatory potential: Opinions about cycling conditions in Reykjavík, Iceland. Cities , 61, pp. 65-73.; Meenar et al. 2019Meenar, M. Flamm, B. Keenan, K. 2019. Mapping Emotional Experience of Travel to Understand Cycle-Transit User Behavior. Sustainability, 11(17), pp. 4743. doi: https://doi.org/10.3390/su11174743
https://doi.org/10.3390/su11174743...
), heat maps (Zeile et al. 2016Zeile, P. Resch, B. Loidl, M. Petutschnig, A. Dörrzapf, L. 2016. Urban Emotions and Cycling Experience-enriching traffic planning for cyclists with human sensor data. GI_Forum, 1, pp. 204-216.), dot maps, choropleth maps, cartograms (Mislove et al. 2010Mislove, A. Lehmann, S. Ahn, Y.-Y. Onnela, J.-P. Rosenquist, J.N. 2010. Pulse of the nation: U.S. mood throughout the day, as inferred from Twitter. [online] (updated 2010) Available at: <Available at: http://www.ccs.neu.edu/home/amislove/twittermood/ >. [Accessed 13 October 2020]
http://www.ccs.neu.edu/home/amislove/twi...
) or continuous surface (Kletter et al. 2013Klettner, S. Huang, H. Schmidt, M. Gartner, G. 2013. Crowdsourcing affective responses to space. Kartographische Nachrichten , 63, pp. 66-73. ). However, these solutions keep the emotions variations subjective because they are based on conventional cartographic methods of symbolisation.
Cartographic representation through graphic symbols that evokes an emotional association with the data is not a new approach. In 1977 Eugene Turner brought to the Thematic Cartography realm the concept of Chernoff faces in the famous map “Life in Los Angeles” (Turner 1977Turner, E. 1977. Life in LA 1970. [online] Available at: <Available at: https://mapdesign.icaci.org/2014/12/mapcarte-353365-life-in-los-angeles-by-eugene-turner-1977/ > [Accessed 12 October 2020].
https://mapdesign.icaci.org/2014/12/mapc...
). The Chernoff’s faces were created by Hermann Chernoff to produce a multivariate symbol that uses the human face to represent different variables (Nunez 2009Nunez, J. J. R. 2009. Ideas for the Use of Chernoff Faces in School Cartography. [online] Available at:<Available at:https://www.researchgate.net/publication/228587294_IDEAS_FOR_THE_USE_OF_CHERNOFF_FACES_IN_SCHOOL_CARTOGRAPHY > [Accessed 12 October 2020].
https://www.researchgate.net/publication...
). In this context the emojis are a modern language that emerged as a graphic alternative to incorporate within thematic cartography (Escoffier 2018Escoffier, E. 2018. Thematic Mapping with Emojis. [online] Available at: <Available at: https://2018.stateofthemap.org/slides/T044-Thematic_mapping_with_emojis.pdf > [Accessed 12 October 2020]
https://2018.stateofthemap.org/slides/T0...
), whereas visually translate subjective concepts, ideas and emotions, enabling sentiment interpretation (Novak et al. 2015Novak, P. K. et al. 2015. Sentiment of emojis. PLoS ONE, 10(12), pp.1-22. doi: 10.1371/journal.pone.0144296.
https://doi.org/10.1371/journal.pone.014...
). Gamio (2017Gamio, L. Chernoff emoji. [online] (updated May 2017) Available at: <Available at: https://flowingdata.com/2017/05/18/chernoff-emoji/ > [Accessed 12 October 2020].
https://flowingdata.com/2017/05/18/chern...
) merged the Chernoff faces and emojis, creating the Chernoff Emojis applied in a USA map that combines variables like uninsured rate, unemployment rate, poverty, obesity, among others. Another example is the Emoji Map of the reactions to unfolding events, like Donald Trump’s inauguration (DT 2017DT. 2017. Mapping Emoji. [online] (updated January 2017) Available at: <Available at: https://rnd.dt.com.au/emojuration-e3acf031040b > [Accessed 12 October 2020].
https://rnd.dt.com.au/emojuration-e3acf0...
). Furthermore, connected to our research work, the emojis are also studied in urban planning applications (Özyıldırım 2019Özyıldırım, E. 2019. Subjective Value Assessment Based on Emojis for Applications in Landscape and Urban Planning [pdf] Dresden: Dresden University of Technology. Available at: <https://cartographymaster.eu/wp-content/theses/2019_Ozyildirim_Thesis.pdf>
https://cartographymaster.eu/wp-content/...
). However, the use of emojis on thematic maps need to be assisted, once they are complex symbols, composed of different forms and colours, which could impact on the cognitive load during the map-reading (Petchenik 1983Petchenik, B. B. 1983. A map maker´s perspective on map design research 1950-1980. In: Graphic Communication And Design Contemporary Cartography.). Additionally, these symbols don’t follow traditional cartography guidelines once they mix several visual variables.
Therefore, we understand that it is possible to create maps with emojis from data collected by collaborative mapping, in order to understand the dynamics of urban mobility and its impact on the emotional response of people living in chaotic cities, such as those in developing countries (Fathullah and Willis 2018Fathullah, A. and Willis, K. 2018. Engaging the Senses: The Potential of Emotional Data for Participation in Urban Planning,. MDPI AG, 2(4), p. 98. doi: 10.3390/urbansci2040098.
https://doi.org/10.3390/urbansci2040098...
; Pánek 2019Pánek, J. 2019. Emotional maps: Participatory crowdsourcing of citizens’ perceptions of their urban environment. Cartographic Perspectives , 2018(91), pp. 17-29. doi: 10.14714/CP91.1419.
https://doi.org/10.14714/CP91.1419...
). Here we argue that collaborative mapping combined with emotional mapping is an exciting tool to understand the gaps in urban planning policies- especially in an urban mobility context, once it allows us to understand the people’s emotional response to different urban environments.
Therefore, in this article, we present a framework to collect and to represent people’s emotions, considering the urban mobility context of Curitiba, one of the largest cities in Brazil. We have interviewed individuals during an intermodal challenge in the city of Curitiba, where they have described their experiences of urban mobility while using different types of transport. While interviewing the individuals, we have encouraged them to indicate the emojis representing “what they felt” along the paths, considering the different types of transport (Novak et al. 2015Novak, P. K. et al. 2015. Sentiment of emojis. PLoS ONE, 10(12), pp.1-22. doi: 10.1371/journal.pone.0144296.
https://doi.org/10.1371/journal.pone.014...
). As a result, we have collected and represented the participant’s feelings all over the routes, considering the different “points-of-view” given by the specific type of transport selected. In the next topics, we present the way we have built this research work, as well as the platform to visualise the interactive emotional maps regarding urban mobility at Curitiba.
2. The case study
We selected Curitiba as the case study, which is one of the large Brazilian cities, located in the southern part of the country. Curitiba has 1.9 million inhabitants; however, the whole metropolitan area achieves 3.5 million citizens, according to the Brazilian Institute of Geography and Statistics - IBGE - estimation (IBGE 2017IBGE. 2017. Portal Cidades@ IBGE. [online] Available at: <https://cidades.ibge.gov.br/brasil/pr/curitiba/panorama.>
https://cidades.ibge.gov.br/brasil/pr/cu...
). In Brazil, Curitiba is recognised for its valuable planning policies related to urban mobility, sometimes associated with pioneer projects in Latin America, such as the implementation of a Bus Rapid Transit (BRT) system. Despite those efforts, according to Duarte (2006Duarte, F. 2006. Redes de mobilidade urbana - Curitiba. Revista dos Transportes Públicos - ANTP, ISSN 0102-7212, pp. 31-46.), Curitiba is still one of the Brazilian cities with the highest number of private cars per inhabitant. These mobility issues led the researchers at the Federal University of Paraná to create the “Ciclovida” Project, aiming to stimulate sustainable urban mobility within that city (Nakamori et al. 2015Nakamori, S. Belotto, J. C. A. Junior, M. F. F. Oliveira, A. G. 2015. A Contribuição Da Academia Para Mobilidade Urbana Sustentável Por Meio Do Programa De Extensão Universitária Da Ufpr - Ciclovida. Revista Políticas Públicas & Cidades, 3(2), pp. 145-163.). Since 2007, the main activity linked to the “Ciclovida Project” is the Intermodal Challenge, which is an activity designed to assess the efficiency of different transport modes (on foot, by car, by bicycle and using public transport), considering its impacts on the time en route, costs, and on the city environment (Martins 2018Martins, G. D. M. 2018. Desafio Intermodal de Curitiba. [online] (updated September 2018). Available at: <http://www.ciclovida.ufpr.br/?s=desafio+intermodal&search=Search>
http://www.ciclovida.ufpr.br/?s=desafio+...
). Each participant departs and arrives from the same point with a different transport mode, and they necessarily should pass to an intermediate point, however, the path they have taken is their own choice.
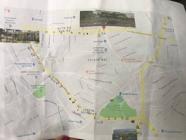
Therefore, for accomplishing this research, we have used the intermodal challenge edition of 2018 as the context for collecting the citizens’ emotions about urban mobility in some parts of Curitiba. The challenge is an instrument for reflection about urban mobility, as the participants were encouraged to observe the paths with a critical view, including emotions. Most of them travelled the paths alone, except for those of the transport mode car, who was accompanied by a person to assist in filling out the information raised. The routes under evaluation, the area we have used as the case study and reference places cited in this work are illustrated in the map (Figure 1). Thus, in the next topics, we describe the methods we have used to collect, represent, and to analyse the participants’ feelings during urban mobility, while they travelled by different transport modes.

3. Methods
First, we have selected 32 (17 males, 15 females) students from the Federal University of Parana, who have participated in the intermodal challenge - edition 2018. The range in age was from 20 to 30 years old. We have invited these students to register their feelings during the route, following the steps we explain below.
Before the activity, we have presented to the participants a list of emojis associated with positive, negative, and neutral emotions. However, during the instructions, we have not shown these categories (positive, negative, and neutral) to keep the participants free for choosing a specific emoji for each one of his/her feelings. Therefore, we selected 20 emojis (Figure 2), each one identified by a single word or expression explaining the meaning we were adopting.

After the initial instructions, each participant received a paper map representing the area where they were about to navigate. The paper maps were chosen to maintain the data collection strategy consistent since the participants already had to fill out other Intermodal Challenge forms that were related to transportation variables and studies. On the other hand, the choice was also reinforced based on security reasons, avoiding the participants having their cell phones exposed.
We have asked the participants to take notes on what emotions they were feeling during their trip, also observing what phenomenon is supposed to trigger that feeling. They have registered their emotions by choosing an emoji and plotting it on the paper map. These emojis are part of a collection (Emojitwo) that was chosen because it is collaborative and free licensed under CC-BY 4.0. After that, they took pictures of their maps (Figure 3) and submitted them on an online platform (Google Forms). Within that online platform, the participants have also registered their names and surnames and the transport modes they used.
Subsequently, we received the data and organised it in a tabular form to count and to classify the emotions collected per mode, participant, and route. Then, we have represented the routes in QGIS, associating the lines with the points/emotions mapped by the participants. We have selected as base map the OpenStreetMap vector data. Finally, we modeled and implemented a geographic database in PostgreSQL, with the spatial extension PostGIS.
Later, we have developed a tool, by using the Google Colab Platform, characterised as “Jupyter notebooks”: these “notebooks” enable the data documentation and analysis, employing visual solutions. That tool was designed to allow the data visualisation of what we have collected during the interviews. We have selected these technological solutions to encourage the use of open-source software, as well as to increase the method reproducibility. Therefore, it is needed to mention we have used Python libraries (folium, psycopg2, ipywidgets, json, nominatim and openrouteservice) to handle the data and program the maps. This graphic (Figure 4) representation allows for a better understanding of the system so that it can be replicated. The system design allows the user to choose parameters that will determine pre-established spatial queries. This process will filter what is represented on the online map. Specifically, it will query the database, that will return the corresponding spatial data, which is then shown as an interactive map.

Finally, we analysed the data collected and represented, aiming to visualise patterns in the participants’ environmental perceptions. Therefore, we have observed the participants’ responses in terms of the factors triggering the emotions in specific places (environmental and urban factors), considering transport mode groups as well as similar feelings mapped.
4. Results and Discussions
Firstly, we have registered 426 points associated with positive (52%) and negative/neutral (48%) emotions. Figures 5 (“a” and “b”) illustrate the frequency distribution of emotions we registered, over the spectra of positive and negative/neutral feelings, respectively.

(a) Number of positive emotions attributed during the intermodal challenge. (b) The number of negative or neutral emotions attributed during the intermodal challenge.
When observing Figure 5, it is noticeable that the emotions “tranquillity” - on the positive side - and “tiredness”/“boredom” - on the negative/neutral side - were on the top of the participants’ preference. We could associate these preferences with general motivations. Therefore, “boredom” and “tranquillity” might be explained by the passive attitude offered by the transport mode selected. For example, while crossing the urban environment by bus, taxi, or uber, people are passive in terms of “paying attention” to the traffic. That “tranquillity” could also trigger the feeling of “boredom” while, en route, people usually stay quiet and motionless. Then, here we explain the higher frequency for “tranquillity”, “tiredness”, and “boredom” because we have received more responses about the transport modes correlated with traveler’s passive attitude (Table 1). On the other hand, feelings such as “gratitude”, “envy”, “impatience”, “laziness”, might be associated with more specific situations, depending on the individual’s internal condition. That means, “gratitude” and “envy”, for example, are particular feelings, generally triggered by personal experiences that might not have a connection with the “human-urban environment” interaction.
Interestingly, “Anxiety/Haste” is almost at the top of the preferences for negative emotions. This is a general condition of modern society, mostly linked with urban life (McKenzie, Murray and Booth 2013McKenzie, K., Murray, A. Booth, T. 2013. Do urban environments increase the risk of anxiety, depression and psychosis? An epidemiological study. Journal of Affective Disorders, Elsevier B.V., 150(3), pp. 1019-1024. doi: 10.1016/j.jad.2013.05.032.
https://doi.org/10.1016/j.jad.2013.05.03...
; Fett, Lemmers-Jansen and Krabbendam 2019Fett, A. K. J., Lemmers-Jansen, I. L. J. Krabbendam, L. 2019. Psychosis and urbanicity: A review of the recent literature from epidemiology to neurourbanism. Current Opinion in Psychiatry, Lippincott Williams and Wilkins, 32(3), pp. 232-241. doi: 10.1097/YCO.0000000000000486.
https://doi.org/10.1097/YCO.000000000000...
). That means people living in urban spaces have been experiencing more anxiety than people living in rural areas (van den Berg, Hartig and Staats 2007van den Berg, A. E., Hartig, T. Staats, H . 2007. Preference for nature in urbanised societies: Stress, restoration, and the pursuit of sustainability. Journal of Social Issues. John Wiley & Sons, Ltd, 63(1), pp. 79-96. doi: 10.1111/j.1540-4560.2007.00497.x.
https://doi.org/10.1111/j.1540-4560.2007...
; McKenzie, Murray and Booth 2013McKenzie, K., Murray, A. Booth, T. 2013. Do urban environments increase the risk of anxiety, depression and psychosis? An epidemiological study. Journal of Affective Disorders, Elsevier B.V., 150(3), pp. 1019-1024. doi: 10.1016/j.jad.2013.05.032.
https://doi.org/10.1016/j.jad.2013.05.03...
). Plenty of urban (social, economic and environmental) variables generally are cited as factors triggering psychological disorders (Fett, Lemmers-Jansen and Krabbendam 2019Fett, A. K. J., Lemmers-Jansen, I. L. J. Krabbendam, L. 2019. Psychosis and urbanicity: A review of the recent literature from epidemiology to neurourbanism. Current Opinion in Psychiatry, Lippincott Williams and Wilkins, 32(3), pp. 232-241. doi: 10.1097/YCO.0000000000000486.
https://doi.org/10.1097/YCO.000000000000...
). Moreover, these psychological disorders are significantly correlated with urban life in developing countries, a condition explained by the socioeconomic disparities and all discrimination spectra (DeVylder et al. 2018DeVylder, J. E. et al. 2018. Association of urbanicity with psychosis in low- and middle-income countries. JAMA Psychiatry. American Medical Association, 75(7), pp. 678-686. doi: 10.1001/jamapsychiatry.2018.0577.
https://doi.org/10.1001/jamapsychiatry.2...
). These statements give support to the results we found.
Subsequently, we have computed the percentage of positive and negative/neutral emotions per mode (Figure 6). There was a prevalence of positive emotions associated with the “Uber” and “Bus”, and negative to the other transport modes. Accordingly, Uber was the transport mode with a higher percentage of positive emotions 57.89%, followed by the bus with 57.39%. Proportionally, the Uber has achieved higher levels of positive emotions compared to the bus mode, once we have counted 190 and 38 responses, respectively. That might be explained because Uber is a private company that creates favourable conditions to provide customer satisfaction. Additionally, people using Uber as a transport mode usually interact with the driver, which could benefit positive experience during the travels in most cases.
In contrast, the higher level of negative emotions was marked at the transport mode “bicycle”. It is noticeable that 70% of the emotions associated with the transport mode “running” are negative; however, proportionally, there were more negative responses linked to the “bicycle” mode. Interestingly, people using a bike as a transport mode have experienced “tiredness” and “fear (mugging)”. Basically, here we connect the “tiredness” with the physical effort naturally made by the participants using this type of transport mode. The “fear (mugging)” emotion might be associated with the lack of the citizens’ security policies, a common experience in developing countries (Cohen 2006Cohen, B. 2006. Urbanisation in developing countries: Current trends, future projections, and key challenges for sustainability. Technology in Society, Elsevier Ltd, 28(1-2), pp. 63-80. doi: 10.1016/j.techsoc.2005.10.005.
https://doi.org/10.1016/j.techsoc.2005.1...
; Banister 2008Banister, D. 2008. The sustainable mobility paradigm. Transport Policy, 15(2), pp. 73-80. doi: 10.1016/j.tranpol.2007.10.005.
https://doi.org/10.1016/j.tranpol.2007.1...
; Hickman, Hall and Banister 2013Hickman, R., Hall, P. Banister, D. 2013. Planning more for sustainable mobility. Journal of Transport Geography . 33, pp. 210-219. doi: 10.1016/j.jtrangeo.2013.07.004.
https://doi.org/10.1016/j.jtrangeo.2013....
; Eckert and Kohler 2014Eckert, S. and Kohler, S. 2014. Urbanisation and health in developing countries: a systematic review., World health & population. doi: 10.12927/whp.2014.23722.
https://doi.org/10.12927/whp.2014.23722...
). Those negative feelings are, somehow, consequences of the social and economic disparities, and a consequence of infrastructure problems (Estes and Mooneyhan 1994Estes, J. E. Mooneyhan, D. W. 1994. Of maps and myths, Photogrammetric Engineering & Remote Sensing, 60(5), pp. 517-524.; Cohen 2006Cohen, B. 2006. Urbanisation in developing countries: Current trends, future projections, and key challenges for sustainability. Technology in Society, Elsevier Ltd, 28(1-2), pp. 63-80. doi: 10.1016/j.techsoc.2005.10.005.
https://doi.org/10.1016/j.techsoc.2005.1...
; Camboim, Bravo and Sluter 2015Camboim, S. P., Bravo, J. V. M. Sluter, C. R. 2015. An investigation into the completeness of, and the updates to, OpenStreetMap data in a heterogeneous area in Brazil. ISPRS International Journal of Geo-Information, 4(3), pp. 1366-1388. doi: 10.3390/ijgi4031366.
https://doi.org/10.3390/ijgi4031366...
). For example, only 13 kilometres (from 45 kilometres) of the route travelled by bicycle had a cycle path on the streets. Thus, it is typical for bikers to feel uncomfortable and to register negative emotions (Pánek and Benediktsson 2016Pánek, J. Benediktsson, K. 2016. Emotional mapping and its participatory potential: Opinions about cycling conditions in Reykjavík, Iceland. Cities , 61, pp. 65-73.).

Comparison of the number of positive and negative/neutral emotion attributed per transport modes.
Furthermore, while observing the spatial distribution of people’s emotions on the online platform we built, we could see patterns easily associated with the existence of urban infrastructure and beautiful features (parks, green areas, monuments). As an example, Figure 7 illustrates maps of the streets where the participants assigned the emojis, corresponding to negative/neutral emotions. Figure 7 also shows the interface of the geoinformation solution we have developed in this research. Indeed, within Figure 7a we have consulted places where people felt “fear (mugging)”; in Figure 7b we identified the emotions placed into a route, established between 2 points. These capabilities were implemented for facilitating the visualisation task, as we mentioned before.

(a) Streets assigned with the emotion of fear (mugging). (b) Negative emotions of a route between two addresses.
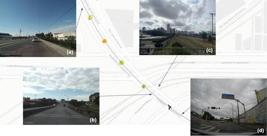
While observing Figure 7a, it is noticeable that the participants attributed the fear of being mugged along the Comendador Franco Avenue, near the Vila Torres neighbourhood. This location is the first informal settlement (“favela”) in Curitiba, where residents live in a fragile social-economic condition. That condition was triggered by the massive migration process seen in the 1970s when Curitiba has expanded its industrial capabilities without planning its geographic occupation (Bianchini 2006Bianchini, F. A. 2006. Vila Torres - Curitiba/PR: Os espaços de representação e as relações de poder. Dissertation. Federal University of Paraná.). Since then, this region has been in the same poor condition, and, consequently, is the focus of adverse social disorders of Curitiba (Bianchini 2006Bianchini, F. A. 2006. Vila Torres - Curitiba/PR: Os espaços de representação e as relações de poder. Dissertation. Federal University of Paraná.). This background might explain the results we found here. In parallel, these negative impressions might also be associated with traffic conditions. Comendador Franco Avenue is a route of fast traffic and, at some times of the day, has slow traffic and a high level of air pollution, noises, and other unfriendly environmental variables. Depending on the hour when participants have transited through this avenue, they could be in touch with that adverse scenario, which might be connected to the feelings we registered.
Similarly, the viaduct Colorado - at the endpoint of the Comendador Franco Avenue, near to Vila Torres - has counted several negative emotions, such as pity, distrust, sadness, fear (mugging) and disgust (Figure 8). Here we link the emotions “sadness”, “pity” and “distrust” to the social conflicts as those previously described. It is needed to mention that some of these negative social-related feelings must be attributed to the existence of homeless people begging for money in that region. Therefore, people who selected individual transport modes were more exposed to that negative scenario.
The viaduct Colorado is also an excellent example of negative environmental-related feeling because it crosses the Belem river. Belem river is an urban watercourse which vertically crosses Curitiba. As a consequence of the environmental disrespect, the Belem river is polluted, especially near Vila Torres (Figura 9a). That is a shred of incontestable evidence that might explain the association with the “disgust” emotion, we found in the interviews. Here we argue that the “disgust” emotion could also be associated with the unpleasant odor coming from the river at that point (IAP 2009Instituto Ambiental do Paraná. 2009. Monitoramento da qualidade das águas dos rios da Bacia do Alto Iguaçu, na Região Metropolitana de Curitiba, no período de 2005 a 2009. p. 51.).
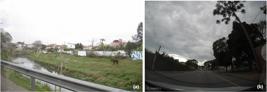
(a) View of Belem river at Vila Torres. (b) View of the João Joaquim Correia da Silva square.
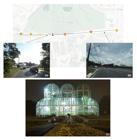
Beyond the negative emotions, Curitiba has locations where the participants felt positive feelings. For example, the Prefeito Lothário Meissner avenue is a route that was frequently annotated with the “admiration (beauty)” emotion. This specific type of feeling has occurred near to the Botanical Garden of Curitiba (Figures 10a, 10b). The park is one of the most important tourist points of Curitiba, settled as a green spot inside the urban landscape. The Botanical Garden has its greenhouse, which is a distinctive building inside the park (Figure 10c).
The results we found demonstrate the connection between positive emotions en route with the presence of green spaces and beautiful monuments (Gascon et al. 2015Gascon, M. et al. 2015. Mental Health Benefits of Long-Term Exposure to Residential Green and Blue Spaces: A Systematic Review. International Journal of Environmental Research and Public Health, MDPI AG , 12(4), pp. 4354-4379. doi: 10.3390/ijerph120404354.
https://doi.org/10.3390/ijerph120404354...
; Fett, Lemmers-Jansen and Krabbendam 2019Fett, A. K. J., Lemmers-Jansen, I. L. J. Krabbendam, L. 2019. Psychosis and urbanicity: A review of the recent literature from epidemiology to neurourbanism. Current Opinion in Psychiatry, Lippincott Williams and Wilkins, 32(3), pp. 232-241. doi: 10.1097/YCO.0000000000000486.
https://doi.org/10.1097/YCO.000000000000...
). For example, the participants had a tendency of recording positive emotions (40 positives vs 22 negatives) along the trajectory Prefeito Lothário Meissner avenue, even though this road also has characteristics like fast traffic, air pollution, noise, that are usually associated with negative emotions. Thus the tendency of positive emotions in this avenue could be explained by the greenness and the presence of the Botanical Garden (Gascon et al. 2015Gascon, M. et al. 2015. Mental Health Benefits of Long-Term Exposure to Residential Green and Blue Spaces: A Systematic Review. International Journal of Environmental Research and Public Health, MDPI AG , 12(4), pp. 4354-4379. doi: 10.3390/ijerph120404354.
https://doi.org/10.3390/ijerph120404354...
). This result was also found in another geographic region with similar characteristics: the Marechal Deodoro Street, near the João Joaquim Correia da Silva square (Figure 9b) presented a high number of positive emotions (86 positives vs 45 negatives). Additionally, it is essential to mention that 23% of positive emotions were attributed to roads located at least within 50 meters of green areas (squares, gardens and parks). These findings support the argument that adequate urban planning policies can create geographic landscapes that cause positive emotions in citizens.
5. Conclusion
Within this article, we propose and validate a methodology for collecting emotional data and represent it in interactive queriable maps using emojis. This approach can contribute to urban planning policies through the perspective of urban mobility, also contributing to the literature about the relationship between VGI and the engagement of citizens in mapping cities. Here we have collected spatial information that fulfils the lack of knowledge about how the citizens see Curitiba, our case study. Likewise, based on the results and the broader literature, we understand that emotional mapping improves the understanding of the city under a citizen-centred perspective, empowering public participation in the urban planning process. For example, mapping emotions such as fear (mugging), might be used in public security policymaking. Besides, mapping emotions could also assist urban planners in identifying variables generating feelings like anxiety, impatience, disturbance (noise), and those linked to decreasing levels of quality of life.
The innovative framework we have developed for collecting and representing emotions over the city of Curitiba has been successful, once we visualised - through emojis and its positions on the map - the emotional content linked to the urban mobility context. Despite the homogeneity of the group of participants in the challenge, with the same age group and level of education, it was possible to validate the methodology and analysis of emotions associated with the urban environment and the geographic features of Curitiba. A recommendation to future works is to increase the number and the heterogeneity of participants.
Specifically, we have found a relationship between positive and negative emotions with urban space. As a result, here we understood that transport modes with a higher proportion of negative emotions might be associated with the participant’s exposure to environmental dangers, the path infrastructure, the greenness, and the urban infrastructure along the route.
Within this work, we also adapted - with an innovative approach - the process of creating emotional maps. Here the emotions have been categorised by the emojis they should represent, which facilitated the interpretation of the responses we have received. Another innovation point is to portray emotions on maps through emojis, which is a modern language insert in people’s daily lives. However, this is an approach that needs to be studied more in future works, since the symbols are complex, composed of different forms and colours and merge diverse visual variables, which could cause a cognitive load, interfering in the map interpretation. Also, the technological advancement promoted by the proposed tool lies upon the fact that it is an open, reproducible, and accessible technology, for collecting, representing, visualising, and analysing people’s emotions over the city space. Differently to the commonly used routing systems, within our geoinformation solution individuals could establish routes based on the emotions they prefer to feel, similarly with the AffectRoutes as cited before. There are also other options, where the paths are classified according to the transport modes and their emotional content, contributing to evaluating the quality associated with the transport mode. For decision-making purposes, that could be developed in future research.
Finally, it is needed to cite that collaborative emotional mapping, also using paper maps such as in this research, for example, provides a surveyed method that could be accessible to most of the population. That is a valuable input that should be considered for urban planners to understand the city under a citizen-centred perspective.
ACKNOWLEDGEMENT
The authors would like to thank Marcia De Andrade Pereira Bernardinis, professor of the Transport Engineering course in Civil Engineering undergraduate degree where the intermodal challenge was held, as well as the students of the discipline for having participated in the data collection. We also thank the undergraduate student of Cartographic and Surveying Engineering Thiago Padilha, who organised the data in tabular form and digitised the routes, as supervised internship work.
REFERENCES
- Banister, D. 2008. The sustainable mobility paradigm. Transport Policy, 15(2), pp. 73-80. doi: 10.1016/j.tranpol.2007.10.005.
» https://doi.org/10.1016/j.tranpol.2007.10.005 - Bechtel, B. et al 2017. Quality of Crowdsourced Data on Urban Morphology -The Human Influence Experiment (HUMINEX). Urban Science, 1(2), doi: 10.3390/urbansci1020015.
» https://doi.org/10.3390/urbansci1020015 - van den Berg, A. E., Hartig, T. Staats, H . 2007. Preference for nature in urbanised societies: Stress, restoration, and the pursuit of sustainability Journal of Social Issues. John Wiley & Sons, Ltd, 63(1), pp. 79-96. doi: 10.1111/j.1540-4560.2007.00497.x.
» https://doi.org/10.1111/j.1540-4560.2007.00497.x - Bianchini, F. A. 2006. Vila Torres - Curitiba/PR: Os espaços de representação e as relações de poder. Dissertation. Federal University of Paraná.
- Calabrese, F. et al 2013. Understanding individual mobility patterns from urban sensing data: A mobile phone trace example. Transportation Research Part C: Emerging Technologies, 26, pp. 301-313. doi: 10.1016/j.trc.2012.09.009.
» https://doi.org/10.1016/j.trc.2012.09.009 - Camboim, S. P., Bravo, J. V. M. Sluter, C. R. 2015. An investigation into the completeness of, and the updates to, OpenStreetMap data in a heterogeneous area in Brazil. ISPRS International Journal of Geo-Information, 4(3), pp. 1366-1388. doi: 10.3390/ijgi4031366.
» https://doi.org/10.3390/ijgi4031366 - Caquard, S. Griffin, A. L. 2019. Mapping emotional cartography. Cartographic Perspectives 4, pp. 4-16. doi: 10.14714/CP91.1551.
» https://doi.org/10.14714/CP91.1551 - Cohen, B. 2006. Urbanisation in developing countries: Current trends, future projections, and key challenges for sustainability. Technology in Society, Elsevier Ltd, 28(1-2), pp. 63-80. doi: 10.1016/j.techsoc.2005.10.005.
» https://doi.org/10.1016/j.techsoc.2005.10.005 - DeVylder, J. E. et al. 2018. Association of urbanicity with psychosis in low- and middle-income countries. JAMA Psychiatry. American Medical Association, 75(7), pp. 678-686. doi: 10.1001/jamapsychiatry.2018.0577.
» https://doi.org/10.1001/jamapsychiatry.2018.0577 - De Oliveira, T. H. M. Painho, M. 2015. Emotion & stress mapping: Assembling an ambient geographic information-based methodology in order to understand smart cities. In: 2015 10th Iberian Conference on Information Systems and Technologies (CISTI), pp.1-4.
- Duarte, F. 2006. Redes de mobilidade urbana - Curitiba. Revista dos Transportes Públicos - ANTP, ISSN 0102-7212, pp. 31-46.
- DT. 2017. Mapping Emoji [online] (updated January 2017) Available at: <Available at: https://rnd.dt.com.au/emojuration-e3acf031040b > [Accessed 12 October 2020].
» https://rnd.dt.com.au/emojuration-e3acf031040b - Eckert, S. and Kohler, S. 2014. Urbanisation and health in developing countries: a systematic review., World health & population. doi: 10.12927/whp.2014.23722.
» https://doi.org/10.12927/whp.2014.23722 - Escoffier, E. 2018. Thematic Mapping with Emojis [online] Available at: <Available at: https://2018.stateofthemap.org/slides/T044-Thematic_mapping_with_emojis.pdf > [Accessed 12 October 2020]
» https://2018.stateofthemap.org/slides/T044-Thematic_mapping_with_emojis.pdf - Estes, J. E. Mooneyhan, D. W. 1994. Of maps and myths, Photogrammetric Engineering & Remote Sensing, 60(5), pp. 517-524.
- Fathullah, A. and Willis, K. 2018. Engaging the Senses: The Potential of Emotional Data for Participation in Urban Planning,. MDPI AG, 2(4), p. 98. doi: 10.3390/urbansci2040098.
» https://doi.org/10.3390/urbansci2040098 - Ferster, C. J. and Coops, N. C. 2013. A review of earth observation using mobile personal communication devices’, Computers & Geosciences. Pergamon, 51, pp. 339-349. doi: 10.1016/J.CAGEO.2012.09.009.
» https://doi.org/10.1016/J.CAGEO.2012.09.009 - Fett, A. K. J., Lemmers-Jansen, I. L. J. Krabbendam, L. 2019. Psychosis and urbanicity: A review of the recent literature from epidemiology to neurourbanism. Current Opinion in Psychiatry, Lippincott Williams and Wilkins, 32(3), pp. 232-241. doi: 10.1097/YCO.0000000000000486.
» https://doi.org/10.1097/YCO.0000000000000486 - Fritz, S., Fonte, C. See, L. 2017. The Role of Citizen Science in Earth Observation. Remote Sensing Multidisciplinary Digital Publishing Institute, 9(4), p. 357. doi: 10.3390/rs9040357.
» https://doi.org/10.3390/rs9040357 - Gamio, L. Chernoff emoji [online] (updated May 2017) Available at: <Available at: https://flowingdata.com/2017/05/18/chernoff-emoji/ > [Accessed 12 October 2020].
» https://flowingdata.com/2017/05/18/chernoff-emoji/ - Gascon, M. et al. 2015. Mental Health Benefits of Long-Term Exposure to Residential Green and Blue Spaces: A Systematic Review. International Journal of Environmental Research and Public Health, MDPI AG , 12(4), pp. 4354-4379. doi: 10.3390/ijerph120404354.
» https://doi.org/10.3390/ijerph120404354 - Gakenheimer, R. 1999. Urban mobility in the developing world. Transportation Research Part A: Policy and Practice. Elsevier Science Ltd, 33(7-8), pp. 671-689. doi: 10.1016/S0965-8564(99)00005-1.
» https://doi.org/10.1016/S0965-8564(99)00005-1 - Godfray, H. C. J. et al 2010. Food Security: The Challenge of Feeding 9 Billion People. Science, 327(5967), pp. 812-818. doi: 10.1126/science.1185383.
» https://doi.org/10.1126/science.1185383 - Goodchild, M. F. 2007. Citizens as sensors: the world of volunteered geography. GeoJournal, Springer Netherlands, 69(4), pp. 211-221. doi: 10.1007/s10708-007-9111-y.
» https://doi.org/10.1007/s10708-007-9111-y - Gössling, S. 2016. Urban transport justice. Journal of Transport Geography, 54, pp. 1-9. doi: 10.1016/j.jtrangeo.2016.05.002.
» https://doi.org/10.1016/j.jtrangeo.2016.05.002 - Griffin, A.L. McQuoid, J. 2012. At the Intersection of Maps and Emotion: The Challenge of Spatially Representing Experience. Kartographische Nachrichten, 6, pp. 291-299.
- Haklay, M. M. 2013. Neogeography and the delusion of democratisation. Environment and Planning A, 45(1), pp. 55-69. doi: 10.1068/a45184.
» https://doi.org/10.1068/a45184 - Haklay, M., Singleton, A. Parker, C. 2008. Web Mapping 2.0: The Neogeography of the GeoWeb. Geography Compass, 2(6), pp. 2011-2039. doi: 10.1111/j.1749-8198.2008.00167.
» https://doi.org/10.1111/j.1749-8198.2008.00167 - Huang, H.; Klettner, S.; Schmidt, M.; Gartner, G.; Leitinger, S.; Wagner, A.; Steinmann, R. 2014. AffectRoute-considering people’s affective responses to environments for enhancing route-planning services. International Journal of Geographical Information Science, 28(12), pp. 2456-2473.
- Heipke, C. 2010. Crowdsourcing geospatial data. ISPRS Journal of Photogrammetry and Remote Sensing . Elsevier, 65(6), pp. 550-557. doi: 10.1016/J.ISPRSJPRS.2010.06.005.
» https://doi.org/10.1016/J.ISPRSJPRS.2010.06.005 - Hickman, R., Hall, P. Banister, D. 2013. Planning more for sustainable mobility. Journal of Transport Geography . 33, pp. 210-219. doi: 10.1016/j.jtrangeo.2013.07.004.
» https://doi.org/10.1016/j.jtrangeo.2013.07.004 - Higgins, P. Campanera, J. M. 2011. (Sustainable) quality of life in English city locations. Cities, 28(4), pp. 209-299. doi: 10.1016/j.cities.2011.02.005.
» https://doi.org/10.1016/j.cities.2011.02.005 - Instituto Ambiental do Paraná. 2009. Monitoramento da qualidade das águas dos rios da Bacia do Alto Iguaçu, na Região Metropolitana de Curitiba, no período de 2005 a 2009. p. 51.
- IBGE. 2017. Portal Cidades@ IBGE. [online] Available at: <https://cidades.ibge.gov.br/brasil/pr/curitiba/panorama.>
» https://cidades.ibge.gov.br/brasil/pr/curitiba/panorama - de Jong, W. 2014. Climate change and deforestation: The evolution of an intersecting policy domain. Environmental Science & Policy, Elsevier, 35, pp. 1-11. doi: 10.1016/J.ENVSCI.2013.06.001.
» https://doi.org/10.1016/J.ENVSCI.2013.06.001 - Klettner, S. Huang, H. Schmidt, M. Gartner, G. 2013. Crowdsourcing affective responses to space. Kartographische Nachrichten , 63, pp. 66-73.
- MacKerron, G. Mourato, S. 2020. Mappiness: natural environments and in-the-moment happiness. In: Handbook on Wellbeing, Happiness and the Environment: Edward Elgar Publishing, pp. 266-282. Ch. 4. doi: 10.4337/9781788119344.00022.
» https://doi.org/10.4337/9781788119344.00022 - McKenzie, K., Murray, A. Booth, T. 2013. Do urban environments increase the risk of anxiety, depression and psychosis? An epidemiological study. Journal of Affective Disorders, Elsevier B.V., 150(3), pp. 1019-1024. doi: 10.1016/j.jad.2013.05.032.
» https://doi.org/10.1016/j.jad.2013.05.032 - Martins, G. D. M. 2018. Desafio Intermodal de Curitiba [online] (updated September 2018). Available at: <http://www.ciclovida.ufpr.br/?s=desafio+intermodal&search=Search>
» http://www.ciclovida.ufpr.br/?s=desafio+intermodal&search=Search - Meenar, M. Flamm, B. Keenan, K. 2019. Mapping Emotional Experience of Travel to Understand Cycle-Transit User Behavior. Sustainability, 11(17), pp. 4743. doi: https://doi.org/10.3390/su11174743
» https://doi.org/10.3390/su11174743 - Mislove, A. Lehmann, S. Ahn, Y.-Y. Onnela, J.-P. Rosenquist, J.N. 2010. Pulse of the nation: U.S. mood throughout the day, as inferred from Twitter. [online] (updated 2010) Available at: <Available at: http://www.ccs.neu.edu/home/amislove/twittermood/ >. [Accessed 13 October 2020]
» http://www.ccs.neu.edu/home/amislove/twittermood/ - Mody, R. N., Willis, K. S. Kerstein, R. 2009. WiMo: Location-based emotion tagging. Proceedings of the 8th International Conference on Mobile and Ubiquitous Multimedia, MUM 2009. pp. 22-25. doi: 10.1145/1658550.1658564.
» https://doi.org/10.1145/1658550.1658564 - Mohan, D., Tiwari, G. Sivaramakrishna, K. C. 2019. Urban mobility. ed. 2019. Sustainable Approaches to Urban Transport. Boca Raton: CRC Press. Ch. 7. doi: 10.1201/9781351004862-7.
» https://doi.org/10.1201/9781351004862-7 - Montgomery, M. R. 2008. The urban transformation of the developing world. Science, 319(5864), pp. 761-764. doi: 10.1126/science.1153012.
» https://doi.org/10.1126/science.1153012 - Nakamori, S. Belotto, J. C. A. Junior, M. F. F. Oliveira, A. G. 2015. A Contribuição Da Academia Para Mobilidade Urbana Sustentável Por Meio Do Programa De Extensão Universitária Da Ufpr - Ciclovida. Revista Políticas Públicas & Cidades, 3(2), pp. 145-163.
- Nold, C. 2009. Introduction: Emotional Cartography, Technologies of the Self [pdf] London: Softhook. Available at: <http://emotionalcartography.net/EmotionalCartographyLow.pdf>
» http://emotionalcartography.net/EmotionalCartographyLow.pdf - Novak, P. K. et al 2015. Sentiment of emojis. PLoS ONE, 10(12), pp.1-22. doi: 10.1371/journal.pone.0144296.
» https://doi.org/10.1371/journal.pone.0144296 - Nunez, J. J. R. 2009. Ideas for the Use of Chernoff Faces in School Cartography. [online] Available at:<Available at:https://www.researchgate.net/publication/228587294_IDEAS_FOR_THE_USE_OF_CHERNOFF_FACES_IN_SCHOOL_CARTOGRAPHY > [Accessed 12 October 2020].
» https://www.researchgate.net/publication/228587294_IDEAS_FOR_THE_USE_OF_CHERNOFF_FACES_IN_SCHOOL_CARTOGRAPHY - Özyıldırım, E. 2019. Subjective Value Assessment Based on Emojis for Applications in Landscape and Urban Planning [pdf] Dresden: Dresden University of Technology. Available at: <https://cartographymaster.eu/wp-content/theses/2019_Ozyildirim_Thesis.pdf>
» https://cartographymaster.eu/wp-content/theses/2019_Ozyildirim_Thesis.pdf - Pánek, J. Benediktsson, K. 2016. Emotional mapping and its participatory potential: Opinions about cycling conditions in Reykjavík, Iceland. Cities , 61, pp. 65-73.
- Pánek, J. 2019. Emotional maps: Participatory crowdsourcing of citizens’ perceptions of their urban environment. Cartographic Perspectives , 2018(91), pp. 17-29. doi: 10.14714/CP91.1419.
» https://doi.org/10.14714/CP91.1419 - Petchenik, B. B. 1983. A map maker´s perspective on map design research 1950-1980. In: Graphic Communication And Design Contemporary Cartography.
- Rahmatizadeh, S., Rajabifard, A. Kalantari, M. 2016. A conceptual framework for utilising VGI in land administration. Land Use Policy, Pergamon, 56, pp. 81-89. doi: 10.1016/J.LANDUSEPOL.2016.04.027.
» https://doi.org/10.1016/J.LANDUSEPOL.2016.04.027 - Rodrigue, J. P., Comtois, C. and Slack, B. 2016. The Geography of Transport Systems 3rd ed. New York: Routledge. doi: 10.4324/9781315618159.
» https://doi.org/10.4324/9781315618159 - See, L. et al 2016 Crowdsourcing, Citizen Science or Volunteered Geographic Information? The Current State of Crowdsourced Geographic Information. ISPRS International Journal of Geo-Information . Multidisciplinary Digital Publishing Institute, 5(5), p. 55. doi: 10.3390/ijgi5050055.
» https://doi.org/10.3390/ijgi5050055 - Seitzinger, S. P. et al 2012. Planetary stewardship in an urbanising world: Beyond city limits. Ambio, 41(8), pp. 787-794. doi: 10.1007/s13280-012-0353-7.
» https://doi.org/10.1007/s13280-012-0353-7 - Shoval, N., Schvimer, Y. Tamir, M. 2018. Tracking technologies and urban analysis: Adding the emotional dimension. Cities , 72, pp. 34-42. doi: 10.1016/j.cities.2017.08.005.
» https://doi.org/10.1016/j.cities.2017.08.005 - Tuan, Y. F. 1974. Topophilia: A Study of Environmental Perceptions, Attitudes, and Values. New York: Columbia University Press.
- Turner, E. 1977. Life in LA 1970. [online] Available at: <Available at: https://mapdesign.icaci.org/2014/12/mapcarte-353365-life-in-los-angeles-by-eugene-turner-1977/ > [Accessed 12 October 2020].
» https://mapdesign.icaci.org/2014/12/mapcarte-353365-life-in-los-angeles-by-eugene-turner-1977/ - Wang, H. et al 2012. Global urbanisation research from 1991 to 2009: A systematic research review. Landscape and Urban Planning Elsevier, 104(3-4), pp. 299-309. doi: 10.1016/j.landurbplan.2011.11.006.
» https://doi.org/10.1016/j.landurbplan.2011.11.006 - Zeile, P. Resch, B. Summa, A. Sagl, G. Exner, J. P. 2015. Urban emotions - Geo-semantic emotion extraction from technical sensors, human sensors and crowdsourced data. In Progress in location-based services 2014. pp. 199-212. Springer, Cham.
- Zeile, P. Resch, B. Loidl, M. Petutschnig, A. Dörrzapf, L. 2016. Urban Emotions and Cycling Experience-enriching traffic planning for cyclists with human sensor data. GI_Forum, 1, pp. 204-216.
Publication Dates
-
Publication in this collection
16 Apr 2021 -
Date of issue
2021
History
-
Received
08 July 2020 -
Accepted
18 Dec 2020

 Source: Authors (2019).
 Source: Emojitwo (
 Source: Participant from the activity (2019).
 Source: Authors (2020).
 Source: Authors (2020).
 Source: Authors (2020).
 Source: Authors (2019).
 Source: Authors (2019) and Mapillary (2020).
 Source: (a) Maristela Mitsuko Ono (2011-2020) - Portal Cuide dos Rios (
 Source: Authors (2019); Mapillary (2020) and Prefeitura Municipal de Curitiba (2020).