Abstract
One of the most important traits that plant breeders aim to improve is grain yield which is a highly quantitative trait controlled by various agro-morphological traits. Twelve morphological traits such as Germination Percentage, Days to Spike Emergence, Plant Height, Spike Length, Awn Length, Tillers/Plant, Leaf Angle, Seeds/Spike, Plant Thickness, 1000-Grain Weight, Harvest Index and Days to Maturity have been considered as independent factors. Correlation, regression, and principal component analysis (PCA) are used to identify the different durum wheat traits, which significantly contribute to the yield. The necessary assumptions required for applying regression modeling have been tested and all the assumptions are satisfied by the observed data. The outliers are detected in the observations of fixed traits and Grain Yield. Some observations are detected as outliers but the outlying observations did not show any influence on the regression fit. For selecting a parsimonious regression model for durum wheat, best subset regression, and stepwise regression techniques have been applied. The best subset regression analysis revealed that Germination Percentage, Tillers/Plant, and Seeds/Spike have a marked increasing effect whereas Plant thickness has a negative effect on durum wheat yield. While stepwise regression analysis identified that the traits, Germination Percentage, Tillers/Plant, and Seeds/Spike significantly contribute to increasing the durum wheat yield. The simple correlation coefficient specified the significant positive correlation of Grain Yield with Germination Percentage, Number of Tillers/Plant, Seeds/Spike, and Harvest Index. These results of correlation analysis directed the importance of morphological characters and their significant positive impact on Grain Yield. The results of PCA showed that most variation (70%) among data set can be explained by the first five components. It also identified that Seeds/Spike; 1000-Grain Weight and Harvest Index have a higher influence in contributing to the durum wheat yield. Based on the results it is recommended that these important parameters might be considered and focused in future durum wheat breeding programs to develop high yield varieties.
Keywords:
parsimonious model; triticum durum; step-wise regression; PCA; rain-fed
Resumo
Uma das características mais importantes que os produtores de plantas visam melhorar é o rendimento de grãos, que é uma particularidade altamente quantitativa e controlada por várias características agromorfológicas. Foram considerados 12 traços morfológicos como fatores independentes, como Porcentagem de Germinação, Dias para Emergência da Espiga, Altura da Planta, Comprimento da Espiga, Comprimento da Aresta, Perfilhos /Planta, Ângulo da Folha, Sementes /Espiga, Espessura da Planta, Peso de 1000 Grãos, Índice de Colheita e Dias até a Maturidade,. A correlação, regressão e análise de componentes principais (em inglês Principal Component Analysis (PCA)) são usadas para identificar as diferentes características do trigo duro, que contribuem significativamente para o rendimento. As suposições necessárias exigidas para a aplicação da modelagem de regressão foram testadas e todas as suposições são adequadas de acordo com os dados observados. Os outliers são detectados nas observações de características fixas e rendimento de grãos. Algumas observações são detectadas como outliers, mas as observações outliers não mostraram qualquer influência no ajuste da regressão. Para selecionar um modelo de regressão parcimonioso para o trigo duro, foram aplicadas tanto a melhor regressão de subconjunto quanto as técnicas de regressão stepwise. A melhor análise de regressão de subconjunto revelou que a porcentagem de germinação, perfilhos /planta e sementes /espiga tem um efeito de aumento acentuado, enquanto a espessura da planta tem um efeito negativo sobre o rendimento do trigo duro. Enquanto a análise de regressão passo a passo identificou que as características, porcentagem de germinação, perfilhos/planta e sementes /espiga contribuem significativamente para aumentar a produtividade do trigo duro. O coeficiente de correlação simples especificou a correlação positiva significativa do rendimento de grãos com a porcentagem de germinação, número de perfilhos/planta, sementes / espiga e índice de colheita. Esses resultados da análise de correlação direcionaram a importância dos caracteres morfológicos e seu impacto positivo e significativo no rendimento de grãos. Os resultados da PCA mostraram que a maior parte da variação (70%) entre o conjunto de dados pôde ser explicada pelos cinco primeiros componentes. Também identificou que Sementes / Espiga, Peso de 1000 Grãos e Índice de Colheita têm uma maior influência na contribuição para o rendimento do trigo duro. Com base nos resultados, recomenda-se que esses importantes parâmetros possam ser considerados e focados em futuros programas de melhoramento de trigo duro para desenvolver variedades de alto rendimento.
Palavras-chave:
modelo parcimonioso; Triticum durum; regressão passo a passo; PCA; agricultura de sequeiro
1. Introduction
Durum wheat (Triticum durum) is an important crop with an estimated global cultivation area over 13 million hectares that constitute only 5-8% of the world wheat production (Kadkol and Sissons, 2016KADKOL, G.P. and SISSONS, M. 2016. Durum Wheat: Overview. In: C. WRIGLEY, H. CORKE and K. SEETHARAMAN, and J. FAUBION, eds. Encyclopedia of Food Grains, 2nd ed. Oxford: Academic Press. pp. 117-124. http://dx.doi.org/10.1016/B978-0-12-394437-5.00024-3.
http://dx.doi.org/10.1016/B978-0-12-3944...
). Turkey and Canada are the world’s largest durum wheat producers with the cultivated area of 2 million hectares each (STAT CA, 2017STATISTIC CANADA – STAT CA, 2017 [viewed 7 April 2020]. Canada: Outlook for Principal Field Crops [online]. Statistic Canada. Available from: http://www.clientadvisoryservices.com/Downloads/Canada%20Principal%20Field%20Crops_October2016Steve1.pdf
http://www.clientadvisoryservices.com/Do...
; USDA FAS, 2015USDA FOREIGN AGRICULTURAL SERVICE – USDA FAS 2015. Grain and Feed Annual; GAIN Report No: TR5016. Ankara, Turkey: Foreign Agricultural Service.), while Pakistan is cultivating durum wheat on only a little above than half-million hectares (USDA FAS, 2015USDA FOREIGN AGRICULTURAL SERVICE – USDA FAS 2015. Grain and Feed Annual; GAIN Report No: TR5016. Ankara, Turkey: Foreign Agricultural Service.). Whereas, urbanization in Pakistan is increasing @ 3% annually which is helping the pasta market to grow further, therefore, the demand of durum wheat products is also increasing (Joshi et al., 2015JOSHI, K.D., LISTMAN, M., ROETT, K., REHMAN, A., SALEEM, T. and ALI, A. 2015. [viewed 22 January 2020]. Durum Wheat Production in Pakistan: Keeping up with Changing Demands [online]. International Maize and Wheat Improvement Center. Available from https://wheat.org/durum-wheat-production-in-pakistan-keeping-up-with-changing-demands/
https://wheat.org/durum-wheat-production...
; Kotkin and Cox, 2013KOTKIN, J. and COX, W., 2013. The world‟s fastest-growing megacities. Forbes, In Press.).
Durum wheat, which is also named as pasta wheat (macaroni wheat), is a type of wheat that has relatively hard, bold, yellow grain with high protein contents, hence, suitable for making pasta products (Noodles, spaghetti, macaroni, Lasagna, shells, fettuccine, and vermicelli), Bulgur, Couscous, bread, etc. and in 2018 worldwide annual production of pasta was 14.5 million tons (IPO, 2020INTERNATIONAL PASTA ORGANISATION – IPO, 2020 [viewed 17 October 2020]. The Truth about Pasta Toolkit [online]. International Pasta Organisation. Available from https://internationalpasta.org/annual-report/
https://internationalpasta.org/annual-re...
). Keeping in view the changing food priorities and increasing demand for pasta synthesized products in Pakistan, CIMMYT is making efforts to alter the local market dynamics to promote disease resistance and high yielding durum wheat varieties with improved grain quality (Joshi et al., 2015JOSHI, K.D., LISTMAN, M., ROETT, K., REHMAN, A., SALEEM, T. and ALI, A. 2015. [viewed 22 January 2020]. Durum Wheat Production in Pakistan: Keeping up with Changing Demands [online]. International Maize and Wheat Improvement Center. Available from https://wheat.org/durum-wheat-production-in-pakistan-keeping-up-with-changing-demands/
https://wheat.org/durum-wheat-production...
).
Grain yield is a very complex attribute, which is determined by many different yield components. Thus, it is essential to detect the yield components having the greatest effect on the yield and their relative contribution to the total variability of the yield. Correlation and path coefficient analysis is the important statistical techniques used to assist crop breeding programs to study the direct and indirect impact of yield components on grain yield. Similarly, the identification of the minimum, but the most important, parameters by building a parsimonious model to predict yield have significant importance to suggest specific parameters that might be used as selection criteria for future breeding programs to improve crop yield. Mohammadi et al. (2011)MOHAMMADI, M., KARIMIZADEH, R., SHEFAZADEH, M.K. and SADEGHZADEH, B., 2011. Statistical analysis of durum wheat yield under semi-warm dryland condition. Australian Journal of Crop Science, vol. 5, no. 10, pp. 1292. applied correlation and regression analysis and identified the existence of high heritability for growth vigor, days to maturity, plant height, peduncle length, number of kernel per spike, flag leaf senescence, spike length, thousand kernel weight and test weight as most effective selection parameters for yield. Good wheat yield could be gained through the selection of breeding materials such as 100-grain weight, high spikes per m2, biological yield, and grain's weight per spike (Lodhi et al., 2017LODHI, S., JOHN, P., POUR, H.A., BIHAMTA, M.R., PEYGHAMBARI, S.A., KAZI, A.M. and GUL, A., 2017. Assessment of Pakistani and Iranian bread wheat landraces using multivariate analysis for grain yield. Pakistan Journal of Botany, vol. 49, no. 6, pp. 2451-2458.; Leilah and Al-Khateeb, 2005LEILAH, A. and AL-KHATEEB, S., 2005. Statistical analysis of wheat yield under drought conditions. Journal of Arid Environments, vol. 61, no. 3, pp. 483-496. http://dx.doi.org/10.1016/j.jaridenv.2004.10.011.
http://dx.doi.org/10.1016/j.jaridenv.200...
). The significant positive correlations of grain yield were observed with number of pods/plant, pod length, and number of seeds/pod. Factor analysis indicated a significant correlation of seed yield of common bean with number of pods/plant and number of seeds/pod in factor 1 (Salehi et al., 2008SALEHI, M., TAJIK, M. and EBADI, A., 2008. The study of relationship between different traits in common bean (Phaseolus vulgaris L.) with multivariate statistical methods. American-Eurasian Journal of Agricultural & Environmental Sciences, vol. 3, no. 6, pp. 806-809.). Through the regression modeling process, the factors Erucic Acid and Pods Length were identified that significantly contribute to increasing the production of the mustard crop in Pakistan (Saleem et al., 2013SALEEM, A., ABBAS, K., ASAD, K. and ANJUM, M., 2013. BEST STATISTICAL MODEL ESTIMATION FOR MUSTARD YIELD IN AZAD KASHMIR, PAKISTAN. Pakistan Journal of Science, vol. 65, no. 1, pp. 77-82.). Mohsen (2013)MOHSEN, A.A., 2013. Correlation and regression analysis in barley. Scientific Research and Review Journal, vol. 1, no. 3, pp. 88-100. used best subset and stepwise regression and identified all the independent variables as significant traits excluding number of seed/spike and seed weight.
The selection of appropriate statistical techniques is the most essential phase in analyzing the statistical data; otherwise, the obtained results may provide a flawed impression for the observed information. It is often observed that the researchers use statistical methodology to analyze their research data without taking into account the feasibility of that statistical technique. To overcome this shortcoming, before the regression model fitting process, assumptions related to residuals have been tested by using different statistical techniques. Multivariate is a statistical procedure about simultaneous perceptions and dissecting at least two factual factors. (Moucheshi et al., 2013MOUCHESHI, S.A., FASIHFAR, E., HASHEMINASAB, H., RAHMANI, A. and AHMADI, A., 2013. A review on applied multivariate statistical techniques in agriculture and plant science. International Journal of Agronomy and Plant Production, vol. 4, pp. 127-141.). In the present study, we are making an effort to explain how multivariate statistical techniques like multiple regression analysis and principal component analysis can be applied as techniques to describe the relationships among various statistical variables and making recommendations for future studies with examples concerning the science of agriculture and plants. The main objective of the study is to identify the most significant traits that have a major influence in improvement of the production of durum wheat.
2. Material and Methods
The secondary data of Agro-Morphological characterization of durum (Triticum turgidum/Triticum durum/Macaroni wheat) wheat accessions has been obtained from Agronomy Research Farm Gahridopatta (34o13’28.8”N, 73o36’55.4”E; atl. 772m) Department of Agriculture Muzaffarabad, Azad Kashmir. The data set is the average of the values recorded during Rabi 2017-18-; Nov 2017 to May 2018. The climate of Gahridopatta is arid with an average annual rainfall of 110 mm (AJ&K, 2018GOVERNMENT AZAD JAMMU KASHMIR – AJ&K. AJ&K Bureau of Statistics, Planning and Development Department, 2018. Statistical Year Book 2018. Planning and Development Department. 23 p.). Agro-Morphological characteristics of durum wheat plant such as Germination Percentage (X1), Days to Spike Emergence (X2), Plant Height (X3), Spike Length (X4), Awn Length (X5), Tillers/Plant (X6), Leaf Angle (X7), Seeds/Spike (X8), Plant Thickness (X9), 1000-Grain Weight (X10), Harvest Index (X11) and Days to Maturity (X12) are considered as explanatory variables whereas Grain Yield (Y) is considered as a response variable. Morphological parameters were recorded before and after harvesting of crop by using the standard descriptors formulated by International Board for Plant Genetic Resources (IBPGR, 1980INTERNATIONAL BOARD FOR PLANT GENETIC RESOURCES – IBPGR, 1980. Maize Descriptors. Rome: Food and Agriculture Organization, pp. 6-8.). A number of assumptions: normality of residuals, the linearity of a regression model, homoscedasticity, autocorrelation and multicollinearity among the variables are tested. Various statistical techniques such as residual plots (Jarque and Bera, 1987JARQUE, C.M. and BERA, A.K., 1987. A test for normality of observations and regression residuals. International Statistical Review/Revue Internationale de Statistique, vol. 55, No. 2, pp. 163-172.), scatter plot, Variance Inflation Factor (Montgomery et al., 2004MONTGOMERY, A.L., LI, S., SRINIVASAN, K. and LIECHTY, J.C., 2004. Modeling online browsing and path analysis using clickstream data. Marketing Science, vol. 23, no. 4, pp. 579-595. http://dx.doi.org/10.1287/mksc.1040.0073.
http://dx.doi.org/10.1287/mksc.1040.0073...
) and Durbin Watson test (Durbin and Watson, 1951DURBIN, J. and WATSON, G.S., 1951. Testing for Serial Correlation in Least Squares Regression. II. Biometrika, vol. 38, no. 1-2, pp. 159-178. http://dx.doi.org/10.1093/biomet/38.1-2.159.
http://dx.doi.org/10.1093/biomet/38.1-2....
) are used to see whether the particular regression modeling is suitable for such kind of data or not.
Methods of leverage values (Chatterjee and Hadi, 1986CHATTERJEE, S. and HADI, A.S., 1986. Influential observations, high leverage points, and outliers in linear regression. Statistical Science, vol. 1, no. 3, pp. 379-393.) and Mahalanobis distance (Mahalanobis, 1936MAHALANOBIS, P.C., 1936. On the generalized distance in statistics. National Institute of Science of India. vol. 2, pp. 49-55.) have been used to detect the outlying observations in fixed traits (X observations) while outlying observations in grain yield (Y observations) have been detected using studentized deleted residuals (Margolin, 1977MARGOLIN, B.H., 1977. The distribution of internally studentized statistics via Laplace transform inversion. Biometrika, vol. 64, no. 3, pp. 573-582. http://dx.doi.org/10.1093/biomet/64.3.573.
http://dx.doi.org/10.1093/biomet/64.3.57...
).
Cook’s distance (Cook, 1977COOK, R.D., 1977. Detection of influential observation in linear regression. Technometrics, vol. 19, no. 1, pp. 15-18.) and DFFITS (Belsley et al., 1980BELSLEY, D.A., KUH, E. and WELSCH, R.E., 1980. Regression diagnostics: identifying influential data and sources of Collinearity. Wiley Series in Probability and Mathematical Statistics. New York: John Wiley & Sons. pp. 11–16. http://dx.doi.org/10.1002/0471725153.
http://dx.doi.org/10.1002/0471725153...
) statistical tests have been used to identify the influence of the detected outliers if any. Different statistical techniques such as best subset regression (Furnival and Wilson, 1974FURNIVAL, G.M. and WILSON, R.W., 1974. Regression by leaps and bounds. Technometrics, vol. 16, no. 4, pp. 499-511. http://dx.doi.org/10.1080/00401706.1974.10489231.
http://dx.doi.org/10.1080/00401706.1974....
) and stepwise regression (Efroymson, 1960EFROYMSON, M.A., 1960. Multiple regression analysis. In: A. RALSTON and H.S. WILF, Mathematical methods for digital computers. New York: John Wiley, pp. 191-203.) procedures have been applied to select a parsimonious statistical model.
Pearson’s product moment coefficient of correlation has been worked out to pick up the most correlated yield traits of durum wheat. To identify the traits that explain most of the variation among the fixed traits, multivariate statistical technique principal component analysis has been employed as described by Curry et al. (1983)CURRY, S., COOPER, R., MCCALLUM, W., POCOCK, P., PAPAKOSTOPOULOS, D., SKIDMORE, S. and NEWTON, P., 1983. The principal components of auditory target detection. Advances in Psychology, vol. 10, pp. 79-117. http://dx.doi.org/10.1016/S0166-4115(08)62035-X.
http://dx.doi.org/10.1016/S0166-4115(08)...
.
3. Results and Discussion
Before selecting a parsimonious statistical model, basic assumptions of regression were tested.
3.1. Normality of the residuals
Normal probability plot of residuals is presented in Figure 1 and most of the points fall reasonably closer to the straight line, suggesting that the errors are approximately normally distributed.

3.2. Linearity and homoscedasticity
To check the appropriateness of a linear regression model, the scattered plot of residuals versus fitted values () is presented in Figure 2. Random scatters of the points with a horizontal axis suggesting that the linear regression model can be used safely and it indicates the linear relationship between Grain Yield and independent variables. Moreover, Figure 2. indicates that there is no systematic pattern in the plotted points, and points are randomly scattered. This suggests that the error variance is constant or homoscedastic.

3.3. Autocorrelation between the errors
To detect the autocorrelation, Durbin Watson Test is used and the value of Durbin Watson test statistic for the durum wheat data is 1.9594 that is very close to “d = 2” showing that there is no first-order autocorrelation present in the model explaining the durum wheat yield
3.4. The problem of multicollinearity
Variance Inflation Factor (VIF) criterion has been used as a device to detect the problem of multicollinearity in durum wheat data. The VIF against each predictor is computed and presented in Table 1. The values of VIF for all the variables are less than 10 indicating that the multicollinearity problem is not present in durum wheat data.
3.5. Detection of outliers
To detect the outliers in durum wheat data, different criteria such as Leverage value, Mahalanobis distance, and Studentized deleted residuals were applied and their values are presented in Table 2.
3.6. Leverage Value
leverage values , and indicated by (*) in Table 2, corresponding to observation 1, 39 and 55 respectively exceed the criterion value that is twice the leverage mean value, . So, it is concluded that the above-mentioned observations are outlying concerning the fixed traits (X values).
3.7. Mahalanobis Distance
According to this criterion, an observation is reflected as an outlier if any squared Mahalanobis distance corresponding to that observation lies outside the ellipse, . Mahalanobis distance values 32.12714, 29.39796, and 49.31471 indicated by (*) in Table 2 corresponding to the observations 1, 39, and 55 respectively lie outside the above criterion. So, it is concluded that these observations are outlying to the fixed traits. Here we observed that both the outlying detection techniques detect the same observations as outlying in fixed traits.
3.8. Studentized Deleted Residuals
To identify outliers in Grain Yield (Y observations), studentized deleted residuals () for large absolute values are considered. An observation is considered as outlying observations if it satisfies the condition that . It is observed from Table 2, that the observations 8, 12, 17, 24, 31, 41, 65, and 74 have values of studentized deleted residuals larger than the above-mentioned criterion. So, these observations of grain yield are detected as outliers.
3.9. Identification of influential observations
To identify whether the outlying observations have any influence on model fitting or not, Cook’s distance and DFFITS statistics were used. It was observed that all the values of Cook’s distance are below F(13,61;0.05) = 1.89 and all the values of DFFITS are less than , which indicates that the influence of these outlying observations is not enough strong to carry out the remedial measures.
3.10. Correlation analysis
The association of various parameters is generally determined by the presence of linkage and pleiotropic effect of different genes. In the present study, a simple correlation is calculated for each pair of the response variable and an explanatory variable to identify the correlation of grain yield with other yield traits of durum wheat. The results of the correlation coefficients with p-values, within parenthesis, are presented in Table 3. A significant positive correlation of grain yield was observed with germination percentage, tiller/plant, seeds/spike, harvest index, and 1000-grain weight. Similar results were reported in different investigations where a significant and positive correlation of grain yield was observed with germination percentage (Al-Musa et al., 2012AL-MUSA, M.A.A., ULLAH, M.A., MONIRUZZAMAN, M., ISLAM, M.S. and MUKHERJEE, A., 2012. Effect of BARI Wheat Varieties on Seed Germination, Growth and Yield under Patuakhali District. Journal of Environmental Science & Natural Resources, vol. 5, no. 2, pp. 209-212. http://dx.doi.org/10.3329/jesnr.v5i2.14816.
http://dx.doi.org/10.3329/jesnr.v5i2.148...
), tiller/plant (Ahmad et al., 2016AHMAD, I., MAHMOOD, N., KHALIQ, I. and KHAN, N., 2016. Genetic analysis for five important mor- phological attributes in wheat (Triticum aestivum L.). Journal of Animal and Plant Sciences, vol. 26, no. 3, pp. 725-730.; Yousif et al., 2015YOUSIF, A.S., JASIM, H., ALI, R. and DHEYA, P., 2015. Some Yield Parameters of Wheat Genotypes. International Journal of Biological, Food. Veterinary and Agricultural Engineering, vol. 9, no. 3, pp. 295-298.; Masood et al., 2014MASOOD, S.A., AHMAD, S., KASHIF, M. and ALI, Q., 2014. Correlation analysis for grain and its con- tributing traits in wheat (Triticum aestivum L.). Nature and Science, vol. 12, no. 11, pp. 168-176.; Anwar et al., 2009ANWAR, J., ALI, M.A.M., HUSSAIN, M.W., SABIR, W.M.A., KHAN, M.A.M., ZULKIFFAL, M. and ABDULLAH, M., 2009. Assessment of yield criteria in bread wheat through correlation and path analysis. The Journal of Animal & Plant Sciences, vol. 19, no. 4, pp. 185-188.;), seeds/spike (Khan and Hassan, 2017KHAN, S.A. and HASSAN, G., 2017. Heritability and correlation studies of yield and yield related traits in bread wheat. Sarhad Journal of Agriculture, vol. 33, no. 1, pp. 103-107. http://dx.doi.org/10.17582/journal.sja/2017.33.1.103.107.
http://dx.doi.org/10.17582/journal.sja/2...
; Uddin et al., 2015UDDIN, F., MOHAMMAD, F. and AHMED, S., 2015. Ge- netic divergence in wheat recombinant inbred lines for yield and yield components. Academia Journal of Agricultural Research, vol. 3, no. 10, pp. 303-307.; Yousif et al., 2015YOUSIF, A.S., JASIM, H., ALI, R. and DHEYA, P., 2015. Some Yield Parameters of Wheat Genotypes. International Journal of Biological, Food. Veterinary and Agricultural Engineering, vol. 9, no. 3, pp. 295-298.; Gelalcha and Hanchinal, 2013GELALCHA, S. and HANCHINAL, R.R., 2013. Correlation and path analysis in yield and yield components in spring bread wheat (Triticum aestivum L.) genotypes under irrigated condition in South- ern India. African Journal of Agricultural Research, vol. 8, no. 24, pp. 3186-3192.; Iftikhar et al., 2013IFTIKHAR, R., HUSSAIN, S.B., KHALIQ, I. and SMIULLAH, 2013. Study of inheritance for grain yield and related traits in bread wheat (Triticum aestivum L.). SABRAO Journal of Breeding and Genetics, vol. 45, no. 2, pp. 283-290.; Sokoto et al., 2012SOKOTO, M.B., ABUBAKAR, U. and DIKKO, A.U., 2012. Correlation analysis of some growth, yield, yield components and grain quality of wheat (Triticum aestivum L.). Nigerian Journal of Basic and Applied Science, vol. 20, no. 4, pp. 349-356.; Akram et al., 2008AKRAM, Z., AJMAL, S.U. and MUNIR, M., 2008. Estimation of correlation coefficient among some yield parameters of wheat under rainfed conditions. Pakistan Journal of Botany, vol. 40, no. 4, pp. 1777-1781.), harvest index (Sokoto et al., 2012SOKOTO, M.B., ABUBAKAR, U. and DIKKO, A.U., 2012. Correlation analysis of some growth, yield, yield components and grain quality of wheat (Triticum aestivum L.). Nigerian Journal of Basic and Applied Science, vol. 20, no. 4, pp. 349-356.) and 1000-grain weight (Khan and Hassan, 2017KHAN, S.A. and HASSAN, G., 2017. Heritability and correlation studies of yield and yield related traits in bread wheat. Sarhad Journal of Agriculture, vol. 33, no. 1, pp. 103-107. http://dx.doi.org/10.17582/journal.sja/2017.33.1.103.107.
http://dx.doi.org/10.17582/journal.sja/2...
; Ahmad et al., 2016AHMAD, I., MAHMOOD, N., KHALIQ, I. and KHAN, N., 2016. Genetic analysis for five important mor- phological attributes in wheat (Triticum aestivum L.). Journal of Animal and Plant Sciences, vol. 26, no. 3, pp. 725-730.; Uddin et al., 2015UDDIN, F., MOHAMMAD, F. and AHMED, S., 2015. Ge- netic divergence in wheat recombinant inbred lines for yield and yield components. Academia Journal of Agricultural Research, vol. 3, no. 10, pp. 303-307.; Yousif et al., 2015YOUSIF, A.S., JASIM, H., ALI, R. and DHEYA, P., 2015. Some Yield Parameters of Wheat Genotypes. International Journal of Biological, Food. Veterinary and Agricultural Engineering, vol. 9, no. 3, pp. 295-298.; Iftikhar et al., 2013IFTIKHAR, R., HUSSAIN, S.B., KHALIQ, I. and SMIULLAH, 2013. Study of inheritance for grain yield and related traits in bread wheat (Triticum aestivum L.). SABRAO Journal of Breeding and Genetics, vol. 45, no. 2, pp. 283-290.; Sokoto et al., 2012SOKOTO, M.B., ABUBAKAR, U. and DIKKO, A.U., 2012. Correlation analysis of some growth, yield, yield components and grain quality of wheat (Triticum aestivum L.). Nigerian Journal of Basic and Applied Science, vol. 20, no. 4, pp. 349-356.; Akram et al., 2008AKRAM, Z., AJMAL, S.U. and MUNIR, M., 2008. Estimation of correlation coefficient among some yield parameters of wheat under rainfed conditions. Pakistan Journal of Botany, vol. 40, no. 4, pp. 1777-1781.). These results also approve the conclusions of Doğan (2009)DOĞAN, R., 2009. The correlation and path coefficient analysis for yield and some yield components of Durum Wheat (Triticum Turgidum Var. Durum L.) In West Anatolia Conditions. Pakistan Journal of Botany, vol. 41, no. 3, pp. 1081-1089., Aycicek and Yildirim (2006)AYCICEK, M. and YILDIRIM, T., 2006. Path coefficient analysis of yield and yield components in bread wheat (Triticum Aestivum L.) Genotypes. Pakistan Journal of Botany, vol. 38, no. 2, pp. 417-424., and Abderrahmane et al. (2013)ABDERRAHMANE, H., ABIDINE, Z.F., HAMENNA, B. and AMMAR, B., 2013. Correlation, path analysis and stepwise regression in Durum Wheat (Triticum Durum Desf.) under Rainfed Conditions. Journal of Agriculture and Sustainability, vol. 3, no. 2, pp. 122-131.. The other parameters such as Plant Height, Awn Length, Leaf Angle, Plant Thickness, and Days to Maturity showed positive and non-significant association with grain yield. Similarly, Days to Spike Emergence and Spike Length recorded negative and non-significant correlation with grain yield. Akram et al. (2008)AKRAM, Z., AJMAL, S.U. and MUNIR, M., 2008. Estimation of correlation coefficient among some yield parameters of wheat under rainfed conditions. Pakistan Journal of Botany, vol. 40, no. 4, pp. 1777-1781. also reported a negative and non-significant relationship of Plant Height and Spike Length with grain yield at the phenotypic level. Similarly, a negative non-significant association of Spike Length and Days to Maturity with Grain Yield was reported by Akram et al. (2008)AKRAM, Z., AJMAL, S.U. and MUNIR, M., 2008. Estimation of correlation coefficient among some yield parameters of wheat under rainfed conditions. Pakistan Journal of Botany, vol. 40, no. 4, pp. 1777-1781.. The positive relationship of Awn Length with grain yield was reported by Motzo and Giunta (2002)MOTZO, R. and GIUNTA, F., 2002. Awareness affects grain yield and kernel weight in near-isogenic lines of durum wheat. Australian Journal of Agricultural Research, vol. 53, no. 12, pp. 1285-1293. http://dx.doi.org/10.1071/AR02008.
http://dx.doi.org/10.1071/AR02008...
. They also concluded that the association of Awn Length with grain yield depends upon different factors e.g. genetic background and environmental conditions. Furthermore, Tungland et al. (1987)TUNGLAND, L., CHAPKO, L.B., WIERSMA, J.V. and RASMUSSON, D.C., 1987. Effect of erect leaf angle on grain yield in barley. Crop Science, vol. 27, no. 1, pp. 37-40. http://dx.doi.org/10.2135/cropsci1987.0011183X002700010009x.
http://dx.doi.org/10.2135/cropsci1987.00...
concluded that the leaf angle has less or no effect on grain yield. The results of the present study for few parameters are also contrary to the findings of previous investigations which could be the result of different environmental conditions, genetic background and sample size and varieties used, as the environment and genetic background play a significant role in the development of phenotypic correlation (Ali et al., 2009ALI, M.A., NAWAB, N.N., ABBAS, A., ZULKIFFAL, M. and SAJJAD, M., 2009. Evaluation of selection criteria in Cicer arietinum L. using correlation coefficients and path analysis. Australian Journal of Crop Science, vol. 3, no. 2, pp. 65-70.; Motzo and Giunta, 2002MOTZO, R. and GIUNTA, F., 2002. Awareness affects grain yield and kernel weight in near-isogenic lines of durum wheat. Australian Journal of Agricultural Research, vol. 53, no. 12, pp. 1285-1293. http://dx.doi.org/10.1071/AR02008.
http://dx.doi.org/10.1071/AR02008...
). The positive significant relationship between grain yield and the important agronomic parameters describes the true relationship between grain yield and these parameters, which is evident that these parameters have pronounced influence upon grain yield. Therefore, based on present findings it is suggested that these parameters should be given prime importance in future wheat breeding programs regarding their significant contribution to enhancing yield.
3.11. Selection of parsimonious model
In the present investigation thirteen yield parameters from durum wheat crop were used to build a model, for the current study, which was parsimonious, which, had the minimum number of parameters and maximum predictive power. To select such a suitable model for predicting grain yield of durum wheat, best subset regression, and stepwise regression techniques were applied. A best subset regression model was obtained through different statistics such as , , and Mallow's . The results of these statistics are summarized in Table 4 and also plots of , , MSE, and are presented in Figure 3a-d. The results from Table 4 and Figures indicated that a model with 4 predictors Germination Percentage (X1), Tillers/Plant (X6), Seeds/Spike (X8), and Plant Thickness (X9) with , and seems to be a good model. These results indicate that above-selected durum wheat traits are the foremost traits for predicting grain yield of durum wheat. By using the stepwise regression technique, it was observed that a model with 3 predictors such as Germination Percentage (X1), Tillers/Plant (X6), and Seeds/Spike (X8) was a good one. The results of the stepwise regression procedure reveal that the above durum wheat traits involved in the selected regression model, significantly contribute to predicting the durum wheat yield. The best subset regression indicates that Germination Percentage (X1), Tillers/Plant (X6), Seeds/Spike (X8), and Plant Thickness (X9) are the foremost traits for predicting grain yield of durum wheat (Table 5). Stepwise regression identifies Germination Percentage (X1), Tillers/Plant (X6) and Seeds/Spike (X8) significantly contributes to predicting the durum wheat yield which is consistent with the findings of Ashmawy et al. (2010)ASHMAWY, F., EL–HABAL M. S., SAUDY H. S. and ABBAS, I.K., 2010. The Relative Contribution Of Yield Components To Grain Yield Of Some Wheat Cultivars Grown Under Different Nitrogen Fertilizer Levels. Egyptian Journal of Agricultural Research, vol. 88, no. 1, pp. 225-239., who reported the importance of spikes/m2 and number of grains/spike to predict variability of wheat grain yield. Similarly, other studies which used stepwise regression techniques also reported the importance of biological yield (Abderrahmane et al., 2013ABDERRAHMANE, H., ABIDINE, Z.F., HAMENNA, B. and AMMAR, B., 2013. Correlation, path analysis and stepwise regression in Durum Wheat (Triticum Durum Desf.) under Rainfed Conditions. Journal of Agriculture and Sustainability, vol. 3, no. 2, pp. 122-131.; Nasri et al., 2014NASRI, R., KASHANI, A., PAKNEJAD, F., VAZAN, S. and BARARY, M., 2014. CORRELATION, PATH ANALYSIS AND STEPWISE REGRESSION IN YIELD AND YIELD COMPONENT IN WHEAT (Triticum aestivum L.) UNDER THE TEMPERATE CLIMATE OF ILAM PROVINCE, IRAN. Indian Journal of Fundamental and Applied Life Sciences., vol. 4, no. 4, pp. 188-198.; Leilah and Al-Khateeb, 2005LEILAH, A. and AL-KHATEEB, S., 2005. Statistical analysis of wheat yield under drought conditions. Journal of Arid Environments, vol. 61, no. 3, pp. 483-496. http://dx.doi.org/10.1016/j.jaridenv.2004.10.011.
http://dx.doi.org/10.1016/j.jaridenv.200...
; Ahmadizadeh et al., 2011AHMADIZADEH, M., NORI, A., SHAHBAZI, H. and AHARIZAD, S., 2011. Correlated response of morpho-physiological traits of grain yield in durum wheat under normal irrigation and drought stress conditions in greenhouse. African Journal of Biotechnology, vol. 10, no. 85, pp. 19771-19779. and Zarei et al., 2011ZAREI, L., CHEGHAMIRZA, K. and FARSHADFAR, E., 2011. Interrelationships of some agronomic characters of durum wheat under supplementary irrigation at grain filling stage conditions. In: Researches of the first international conference, 2011, Kermanshah. Kermanshah: Razi Universities, pp. 211-215.) in wheat, seeds per pod, pods per plant (Rameeh, 2016RAMEEH, V., 2016. Stepwise regression and principal component analyses for quantitative traits of rapeseed genotypes at different sowing dates. Journal of Agricultural Sciences, vol. 61, no. 4, pp. 323-332. http://dx.doi.org/10.2298/JAS1604323R.
http://dx.doi.org/10.2298/JAS1604323R...
) in rapeseed and beans (Rahnamaeetak et al., 2007RAHNAMAEETAK, A., VAEEZI, S., MASAFARI, J. and BOSHEHRI, A.A., 2007. Correlation and causalityanalysis and yield-related traits in red beans. Iranian Journal of Research and Development, vol. 80, pp. 95-102.). However, the results of the present study were not in a complete agreement with the findings of other researchers, who found that spikes/m2, 1000 grain weight and plant height (Soleymanifard et al. 2012SOLEYMANIFARD, A., NASERI, R. and MEYSAM, M., 2012. The study genetic variation and factor analysis for agronomic traits of Durum wheat genotypes using cluster analysis and path analysis under drought stress condition in western of Iran. International Research Journal of Applied and Basic Sciences, vol. 3, no. 3, pp. 479-485.-75%), biological yield and harvest index (Abderrahmane et al., 2013ABDERRAHMANE, H., ABIDINE, Z.F., HAMENNA, B. and AMMAR, B., 2013. Correlation, path analysis and stepwise regression in Durum Wheat (Triticum Durum Desf.) under Rainfed Conditions. Journal of Agriculture and Sustainability, vol. 3, no. 2, pp. 122-131.), biological yield, harvest index and weight spike/unit (Nasri et al., 2014NASRI, R., KASHANI, A., PAKNEJAD, F., VAZAN, S. and BARARY, M., 2014. CORRELATION, PATH ANALYSIS AND STEPWISE REGRESSION IN YIELD AND YIELD COMPONENT IN WHEAT (Triticum aestivum L.) UNDER THE TEMPERATE CLIMATE OF ILAM PROVINCE, IRAN. Indian Journal of Fundamental and Applied Life Sciences., vol. 4, no. 4, pp. 188-198.) contributes to predicting 75%, 98.3% and 98.3% yield in wheat, respectively. This difference may be due to the environmental factors, plant growth conditions, and time of sowing which could modify the yield predictive model of stepwise regression techniques (Golabadi et al., 2005GOLABADI, M., ARZANI, A. and MAIBODY, S.A.M., 2005. Evaluation of variation among durum wheat f3 families for grain yield and its components under normal and water-stress field conditions. Czech Journal of Genetics and Plant Breeding, vol. 41, no. Special Issue, pp. 263-267. http://dx.doi.org/10.17221/6188-CJGPB.
http://dx.doi.org/10.17221/6188-CJGPB...
; Rameeh, 2016RAMEEH, V., 2016. Stepwise regression and principal component analyses for quantitative traits of rapeseed genotypes at different sowing dates. Journal of Agricultural Sciences, vol. 61, no. 4, pp. 323-332. http://dx.doi.org/10.2298/JAS1604323R.
http://dx.doi.org/10.2298/JAS1604323R...
). Golabadi et al. (2005)GOLABADI, M., ARZANI, A. and MAIBODY, S.A.M., 2005. Evaluation of variation among durum wheat f3 families for grain yield and its components under normal and water-stress field conditions. Czech Journal of Genetics and Plant Breeding, vol. 41, no. Special Issue, pp. 263-267. http://dx.doi.org/10.17221/6188-CJGPB.
http://dx.doi.org/10.17221/6188-CJGPB...
executed a stepwise regression technique to predict the yield and reported a model with biological yield under full irrigation and harvest index under stress conditions. Similarly, Rameeh (2016)RAMEEH, V., 2016. Stepwise regression and principal component analyses for quantitative traits of rapeseed genotypes at different sowing dates. Journal of Agricultural Sciences, vol. 61, no. 4, pp. 323-332. http://dx.doi.org/10.2298/JAS1604323R.
http://dx.doi.org/10.2298/JAS1604323R...
also revealed that under different sowing dates different yield components had entered the seed yield prediction model while using stepwise regression techniques.

3.12. Principal component analysis
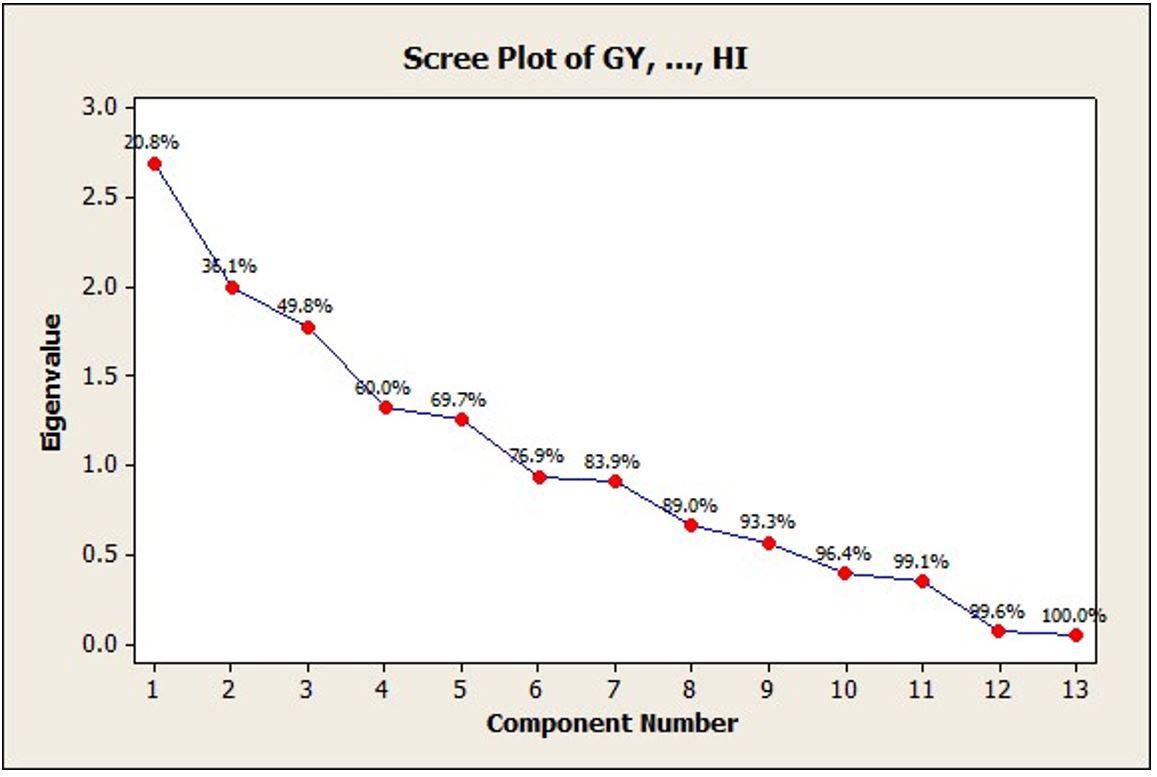
To identify the factors that explain most of the variation in grain yield, we used a multivariate technique such as principal component analysis. The factors with eigenvalues are presented in Table 6. The first five components have eigenvalues higher than 1 and can explain almost 70% of the total variation among data. Variation explained by different components is also indicated in Figure 4. Principal component analysis suggests that the first five principal components out of thirteen components account for almost 70% of the total variation. Moreover, the first component includes the traits, Seeds/Spike (X8), 1000-Grain Weight (X10), and Harvest Index (X11). The second principal component includes Days to Spike Emergence (X2) having a positive loading sign whereas Awn Length (X5) having a negative loading sign that explains that these traits have a higher effect on grain yield. A similar kind of investigation has also been carried out in wheat by Kumar et al., (2016)KUMAR, J., KUMAR, A., SINGH, S.K., SINGH, L., KUMAR, A., CHAUDHARY, M., KUMAR, S. and SINGH, S.K., 2016. Principal component analysis for yield and its contributing traits in bread wheat (Triticum aestivum) genotypes under late sown condition. Current Advances in Agricultural Sciences, vol. 8, no. 1, pp. 55-57. http://dx.doi.org/10.5958/2394-4471.2016.00011.3.
http://dx.doi.org/10.5958/2394-4471.2016...
and reported that six principal components including yield parameters accounted for 81.75% of the total variation for grain yield. Beheshtizadeh et al., (2013)BEHESHTIZADEH, H., REZAIE, A. and GHANDI, A., 2013. Principal component analysis and determination of the selection criteria in bread wheat (Triticum aestivum L.) genotypes. International Journal of Agriculture and Crop Sciences, vol. 5, no. 18, pp. 2024-2027. also concluded that four principal components out of eleven agronomic parameters were responsible for about 76% of the total variation among traits in bread wheat cultivars. Similar results were also reported by Ahmad et al. (2017)AHMAD, S., PASHA, I., SAEED, M. and SHAHID, M., 2017. Principal component analysis and correlation studies of spring wheats in relation to cookie making quality. International Journal of Food Properties, vol. 20, no. 10, pp. 2299-2313. http://dx.doi.org/10.1080/10942912.2016.1236273.
http://dx.doi.org/10.1080/10942912.2016....
, Krzysko et al. (2013)KRZYSKO, M., DEREJKO, A., GORECKI, T. and GACEK, E., 2013. Principal component analysis for functional data on grain yield of winter wheat cultivars. Biometrical Letters, vol. 50, no. 2, pp. 81-94. http://dx.doi.org/10.2478/bile-2013-0019.
http://dx.doi.org/10.2478/bile-2013-0019...
, and Rymuza et al. (2012)RYMUZA, K., TURSKA, E., WIELOGÓRSKA, G. and BOMBIK, A., 2012. USE OF Principal Component Analysis For The Assessment Of Spring Wheat Characteristics. Search Results Web results Acta Scientiarum Polonorum seria. Agricultura, vol. 11, no. 1, pp. 79-90. during variability studies in wheat crop. They reported 1000 grain yield and grain yield as the first principal component and the major contributor followed by spike related parameters.

4. Conclusion
In the present study, Germination Percentage, Tiller/Plant, Seeds/Spike, Harvest Index, and 1000-Grain Weight showed significant and positive association to grain yield and performed as the major contributors towards grain yield. Similarly, the best subset regression indicated that Germination Percentage, Tillers/Plant, Seeds/Spike, and Plant Thickness are the main parameters with maximum predictive power to access grain yield and this parsimonious regression model with 4 predictors appeared to be good and suitable. Furthermore, the principal component analysis suggested that Seeds/Spike, 1000-Grain Weight, Harvest Index, Days to Spike Emergence, and Awn Length accounted for almost 70% of the total variation. Therefore, it is suggested that these parameters might be used as selection criteria by plant breeders and could be focused while breeding high yielding durum wheat varieties.
Acknowledgements
Authors would like to thank the agronomy section, directorate of research, department of agriculture Azad Jammu and Kashmir for technical and financial support.
Kamran Abbas and Faisal Rahim designed this project and supervised the research. Kamran Abbas, Faisal Rahim and Mubasher Hussain performed the research trial, analyzed the data and wrote the manuscript, and all are considered first authors of this manuscript. All co‐authors were involved in editing the manuscript.
Reference
- ABDERRAHMANE, H., ABIDINE, Z.F., HAMENNA, B. and AMMAR, B., 2013. Correlation, path analysis and stepwise regression in Durum Wheat (Triticum Durum Desf.) under Rainfed Conditions. Journal of Agriculture and Sustainability, vol. 3, no. 2, pp. 122-131.
- AHMAD, I., MAHMOOD, N., KHALIQ, I. and KHAN, N., 2016. Genetic analysis for five important mor- phological attributes in wheat (Triticum aestivum L.). Journal of Animal and Plant Sciences, vol. 26, no. 3, pp. 725-730.
- AHMAD, S., PASHA, I., SAEED, M. and SHAHID, M., 2017. Principal component analysis and correlation studies of spring wheats in relation to cookie making quality. International Journal of Food Properties, vol. 20, no. 10, pp. 2299-2313. http://dx.doi.org/10.1080/10942912.2016.1236273
» http://dx.doi.org/10.1080/10942912.2016.1236273 - AHMADIZADEH, M., NORI, A., SHAHBAZI, H. and AHARIZAD, S., 2011. Correlated response of morpho-physiological traits of grain yield in durum wheat under normal irrigation and drought stress conditions in greenhouse. African Journal of Biotechnology, vol. 10, no. 85, pp. 19771-19779.
- ASHMAWY, F., EL–HABAL M. S., SAUDY H. S. and ABBAS, I.K., 2010. The Relative Contribution Of Yield Components To Grain Yield Of Some Wheat Cultivars Grown Under Different Nitrogen Fertilizer Levels. Egyptian Journal of Agricultural Research, vol. 88, no. 1, pp. 225-239.
- AKRAM, Z., AJMAL, S.U. and MUNIR, M., 2008. Estimation of correlation coefficient among some yield parameters of wheat under rainfed conditions. Pakistan Journal of Botany, vol. 40, no. 4, pp. 1777-1781.
- ALI, M.A., NAWAB, N.N., ABBAS, A., ZULKIFFAL, M. and SAJJAD, M., 2009. Evaluation of selection criteria in Cicer arietinum L. using correlation coefficients and path analysis. Australian Journal of Crop Science, vol. 3, no. 2, pp. 65-70.
- AL-MUSA, M.A.A., ULLAH, M.A., MONIRUZZAMAN, M., ISLAM, M.S. and MUKHERJEE, A., 2012. Effect of BARI Wheat Varieties on Seed Germination, Growth and Yield under Patuakhali District. Journal of Environmental Science & Natural Resources, vol. 5, no. 2, pp. 209-212. http://dx.doi.org/10.3329/jesnr.v5i2.14816
» http://dx.doi.org/10.3329/jesnr.v5i2.14816 - ANWAR, J., ALI, M.A.M., HUSSAIN, M.W., SABIR, W.M.A., KHAN, M.A.M., ZULKIFFAL, M. and ABDULLAH, M., 2009. Assessment of yield criteria in bread wheat through correlation and path analysis. The Journal of Animal & Plant Sciences, vol. 19, no. 4, pp. 185-188.
- AYCICEK, M. and YILDIRIM, T., 2006. Path coefficient analysis of yield and yield components in bread wheat (Triticum Aestivum L.) Genotypes. Pakistan Journal of Botany, vol. 38, no. 2, pp. 417-424.
- BEHESHTIZADEH, H., REZAIE, A. and GHANDI, A., 2013. Principal component analysis and determination of the selection criteria in bread wheat (Triticum aestivum L.) genotypes. International Journal of Agriculture and Crop Sciences, vol. 5, no. 18, pp. 2024-2027.
- BELSLEY, D.A., KUH, E. and WELSCH, R.E., 1980. Regression diagnostics: identifying influential data and sources of Collinearity. Wiley Series in Probability and Mathematical Statistics New York: John Wiley & Sons. pp. 11–16. http://dx.doi.org/10.1002/0471725153
» http://dx.doi.org/10.1002/0471725153 - CHATTERJEE, S. and HADI, A.S., 1986. Influential observations, high leverage points, and outliers in linear regression. Statistical Science, vol. 1, no. 3, pp. 379-393.
- COOK, R.D., 1977. Detection of influential observation in linear regression. Technometrics, vol. 19, no. 1, pp. 15-18.
- CURRY, S., COOPER, R., MCCALLUM, W., POCOCK, P., PAPAKOSTOPOULOS, D., SKIDMORE, S. and NEWTON, P., 1983. The principal components of auditory target detection. Advances in Psychology, vol. 10, pp. 79-117. http://dx.doi.org/10.1016/S0166-4115(08)62035-X
» http://dx.doi.org/10.1016/S0166-4115(08)62035-X - DOĞAN, R., 2009. The correlation and path coefficient analysis for yield and some yield components of Durum Wheat (Triticum Turgidum Var. Durum L.) In West Anatolia Conditions. Pakistan Journal of Botany, vol. 41, no. 3, pp. 1081-1089.
- DURBIN, J. and WATSON, G.S., 1951. Testing for Serial Correlation in Least Squares Regression. II. Biometrika, vol. 38, no. 1-2, pp. 159-178. http://dx.doi.org/10.1093/biomet/38.1-2.159
» http://dx.doi.org/10.1093/biomet/38.1-2.159 - EFROYMSON, M.A., 1960. Multiple regression analysis. In: A. RALSTON and H.S. WILF, Mathematical methods for digital computers New York: John Wiley, pp. 191-203.
- GOLABADI, M., ARZANI, A. and MAIBODY, S.A.M., 2005. Evaluation of variation among durum wheat f3 families for grain yield and its components under normal and water-stress field conditions. Czech Journal of Genetics and Plant Breeding, vol. 41, no. Special Issue, pp. 263-267. http://dx.doi.org/10.17221/6188-CJGPB
» http://dx.doi.org/10.17221/6188-CJGPB - FURNIVAL, G.M. and WILSON, R.W., 1974. Regression by leaps and bounds. Technometrics, vol. 16, no. 4, pp. 499-511. http://dx.doi.org/10.1080/00401706.1974.10489231
» http://dx.doi.org/10.1080/00401706.1974.10489231 - GELALCHA, S. and HANCHINAL, R.R., 2013. Correlation and path analysis in yield and yield components in spring bread wheat (Triticum aestivum L.) genotypes under irrigated condition in South- ern India. African Journal of Agricultural Research, vol. 8, no. 24, pp. 3186-3192.
- GOVERNMENT AZAD JAMMU KASHMIR – AJ&K. AJ&K Bureau of Statistics, Planning and Development Department, 2018. Statistical Year Book 2018 Planning and Development Department. 23 p.
- IFTIKHAR, R., HUSSAIN, S.B., KHALIQ, I. and SMIULLAH, 2013. Study of inheritance for grain yield and related traits in bread wheat (Triticum aestivum L.). SABRAO Journal of Breeding and Genetics, vol. 45, no. 2, pp. 283-290.
- INTERNATIONAL BOARD FOR PLANT GENETIC RESOURCES – IBPGR, 1980. Maize Descriptors Rome: Food and Agriculture Organization, pp. 6-8.
- INTERNATIONAL PASTA ORGANISATION – IPO, 2020 [viewed 17 October 2020]. The Truth about Pasta Toolkit [online]. International Pasta Organisation. Available from https://internationalpasta.org/annual-report/
» https://internationalpasta.org/annual-report/ - JARQUE, C.M. and BERA, A.K., 1987. A test for normality of observations and regression residuals. International Statistical Review/Revue Internationale de Statistique, vol. 55, No. 2, pp. 163-172.
- JOSHI, K.D., LISTMAN, M., ROETT, K., REHMAN, A., SALEEM, T. and ALI, A. 2015. [viewed 22 January 2020]. Durum Wheat Production in Pakistan: Keeping up with Changing Demands [online]. International Maize and Wheat Improvement Center. Available from https://wheat.org/durum-wheat-production-in-pakistan-keeping-up-with-changing-demands/
» https://wheat.org/durum-wheat-production-in-pakistan-keeping-up-with-changing-demands/ - KADKOL, G.P. and SISSONS, M. 2016. Durum Wheat: Overview. In: C. WRIGLEY, H. CORKE and K. SEETHARAMAN, and J. FAUBION, eds. Encyclopedia of Food Grains, 2nd ed. Oxford: Academic Press. pp. 117-124. http://dx.doi.org/10.1016/B978-0-12-394437-5.00024-3
» http://dx.doi.org/10.1016/B978-0-12-394437-5.00024-3 - KHAN, S.A. and HASSAN, G., 2017. Heritability and correlation studies of yield and yield related traits in bread wheat. Sarhad Journal of Agriculture, vol. 33, no. 1, pp. 103-107. http://dx.doi.org/10.17582/journal.sja/2017.33.1.103.107
» http://dx.doi.org/10.17582/journal.sja/2017.33.1.103.107 - KOTKIN, J. and COX, W., 2013. The world‟s fastest-growing megacities. Forbes, In Press.
- KRZYSKO, M., DEREJKO, A., GORECKI, T. and GACEK, E., 2013. Principal component analysis for functional data on grain yield of winter wheat cultivars. Biometrical Letters, vol. 50, no. 2, pp. 81-94. http://dx.doi.org/10.2478/bile-2013-0019
» http://dx.doi.org/10.2478/bile-2013-0019 - KUMAR, J., KUMAR, A., SINGH, S.K., SINGH, L., KUMAR, A., CHAUDHARY, M., KUMAR, S. and SINGH, S.K., 2016. Principal component analysis for yield and its contributing traits in bread wheat (Triticum aestivum) genotypes under late sown condition. Current Advances in Agricultural Sciences, vol. 8, no. 1, pp. 55-57. http://dx.doi.org/10.5958/2394-4471.2016.00011.3
» http://dx.doi.org/10.5958/2394-4471.2016.00011.3 - LEILAH, A. and AL-KHATEEB, S., 2005. Statistical analysis of wheat yield under drought conditions. Journal of Arid Environments, vol. 61, no. 3, pp. 483-496. http://dx.doi.org/10.1016/j.jaridenv.2004.10.011
» http://dx.doi.org/10.1016/j.jaridenv.2004.10.011 - LODHI, S., JOHN, P., POUR, H.A., BIHAMTA, M.R., PEYGHAMBARI, S.A., KAZI, A.M. and GUL, A., 2017. Assessment of Pakistani and Iranian bread wheat landraces using multivariate analysis for grain yield. Pakistan Journal of Botany, vol. 49, no. 6, pp. 2451-2458.
- MAHALANOBIS, P.C., 1936. On the generalized distance in statistics. National Institute of Science of India vol. 2, pp. 49-55.
- MARGOLIN, B.H., 1977. The distribution of internally studentized statistics via Laplace transform inversion. Biometrika, vol. 64, no. 3, pp. 573-582. http://dx.doi.org/10.1093/biomet/64.3.573
» http://dx.doi.org/10.1093/biomet/64.3.573 - MASOOD, S.A., AHMAD, S., KASHIF, M. and ALI, Q., 2014. Correlation analysis for grain and its con- tributing traits in wheat (Triticum aestivum L.). Nature and Science, vol. 12, no. 11, pp. 168-176.
- MOHAMMADI, M., KARIMIZADEH, R., SHEFAZADEH, M.K. and SADEGHZADEH, B., 2011. Statistical analysis of durum wheat yield under semi-warm dryland condition. Australian Journal of Crop Science, vol. 5, no. 10, pp. 1292.
- MOHSEN, A.A., 2013. Correlation and regression analysis in barley. Scientific Research and Review Journal, vol. 1, no. 3, pp. 88-100.
- MONTGOMERY, A.L., LI, S., SRINIVASAN, K. and LIECHTY, J.C., 2004. Modeling online browsing and path analysis using clickstream data. Marketing Science, vol. 23, no. 4, pp. 579-595. http://dx.doi.org/10.1287/mksc.1040.0073
» http://dx.doi.org/10.1287/mksc.1040.0073 - MOTZO, R. and GIUNTA, F., 2002. Awareness affects grain yield and kernel weight in near-isogenic lines of durum wheat. Australian Journal of Agricultural Research, vol. 53, no. 12, pp. 1285-1293. http://dx.doi.org/10.1071/AR02008
» http://dx.doi.org/10.1071/AR02008 - MOUCHESHI, S.A., FASIHFAR, E., HASHEMINASAB, H., RAHMANI, A. and AHMADI, A., 2013. A review on applied multivariate statistical techniques in agriculture and plant science. International Journal of Agronomy and Plant Production, vol. 4, pp. 127-141.
- NASRI, R., KASHANI, A., PAKNEJAD, F., VAZAN, S. and BARARY, M., 2014. CORRELATION, PATH ANALYSIS AND STEPWISE REGRESSION IN YIELD AND YIELD COMPONENT IN WHEAT (Triticum aestivum L.) UNDER THE TEMPERATE CLIMATE OF ILAM PROVINCE, IRAN. Indian Journal of Fundamental and Applied Life Sciences., vol. 4, no. 4, pp. 188-198.
- RAHNAMAEETAK, A., VAEEZI, S., MASAFARI, J. and BOSHEHRI, A.A., 2007. Correlation and causalityanalysis and yield-related traits in red beans. Iranian Journal of Research and Development, vol. 80, pp. 95-102.
- RAMEEH, V., 2016. Stepwise regression and principal component analyses for quantitative traits of rapeseed genotypes at different sowing dates. Journal of Agricultural Sciences, vol. 61, no. 4, pp. 323-332. http://dx.doi.org/10.2298/JAS1604323R
» http://dx.doi.org/10.2298/JAS1604323R - RYMUZA, K., TURSKA, E., WIELOGÓRSKA, G. and BOMBIK, A., 2012. USE OF Principal Component Analysis For The Assessment Of Spring Wheat Characteristics. Search Results Web results Acta Scientiarum Polonorum seria. Agricultura, vol. 11, no. 1, pp. 79-90.
- SALEHI, M., TAJIK, M. and EBADI, A., 2008. The study of relationship between different traits in common bean (Phaseolus vulgaris L.) with multivariate statistical methods. American-Eurasian Journal of Agricultural & Environmental Sciences, vol. 3, no. 6, pp. 806-809.
- SOKOTO, M.B., ABUBAKAR, U. and DIKKO, A.U., 2012. Correlation analysis of some growth, yield, yield components and grain quality of wheat (Triticum aestivum L.). Nigerian Journal of Basic and Applied Science, vol. 20, no. 4, pp. 349-356.
- SOLEYMANIFARD, A., NASERI, R. and MEYSAM, M., 2012. The study genetic variation and factor analysis for agronomic traits of Durum wheat genotypes using cluster analysis and path analysis under drought stress condition in western of Iran. International Research Journal of Applied and Basic Sciences, vol. 3, no. 3, pp. 479-485.
- SALEEM, A., ABBAS, K., ASAD, K. and ANJUM, M., 2013. BEST STATISTICAL MODEL ESTIMATION FOR MUSTARD YIELD IN AZAD KASHMIR, PAKISTAN. Pakistan Journal of Science, vol. 65, no. 1, pp. 77-82.
- STATISTIC CANADA – STAT CA, 2017 [viewed 7 April 2020]. Canada: Outlook for Principal Field Crops [online]. Statistic Canada. Available from: http://www.clientadvisoryservices.com/Downloads/Canada%20Principal%20Field%20Crops_October2016Steve1.pdf
» http://www.clientadvisoryservices.com/Downloads/Canada%20Principal%20Field%20Crops_October2016Steve1.pdf - TUNGLAND, L., CHAPKO, L.B., WIERSMA, J.V. and RASMUSSON, D.C., 1987. Effect of erect leaf angle on grain yield in barley. Crop Science, vol. 27, no. 1, pp. 37-40. http://dx.doi.org/10.2135/cropsci1987.0011183X002700010009x
» http://dx.doi.org/10.2135/cropsci1987.0011183X002700010009x - UDDIN, F., MOHAMMAD, F. and AHMED, S., 2015. Ge- netic divergence in wheat recombinant inbred lines for yield and yield components. Academia Journal of Agricultural Research, vol. 3, no. 10, pp. 303-307.
- USDA FOREIGN AGRICULTURAL SERVICE – USDA FAS 2015. Grain and Feed Annual; GAIN Report No: TR5016. Ankara, Turkey: Foreign Agricultural Service.
- YOUSIF, A.S., JASIM, H., ALI, R. and DHEYA, P., 2015. Some Yield Parameters of Wheat Genotypes. International Journal of Biological, Food. Veterinary and Agricultural Engineering, vol. 9, no. 3, pp. 295-298.
- ZAREI, L., CHEGHAMIRZA, K. and FARSHADFAR, E., 2011. Interrelationships of some agronomic characters of durum wheat under supplementary irrigation at grain filling stage conditions. In: Researches of the first international conference, 2011, Kermanshah. Kermanshah: Razi Universities, pp. 211-215.
Publication Dates
-
Publication in this collection
28 June 2021 -
Date of issue
2022
History
-
Received
28 June 2020 -
Accepted
19 Oct 2020