Abstract
Selection can affect growth, changing performance and asymptotic values. However, there is little information about the growth of families in fish breeding programs. The aim of this study was to evaluate the performance and growth of families of Nile tilapia AquaAmérica. Twenty AquaAmérica families cultivated in a net cage (13.5 m3) for 181 days were evaluated. The nonlinear Gompertz regression model was fitted to the data by the weighted least squares method, taking the inverse of the variance of weight in different families and at different ages as the weighting variable. The model was adjusted to describe the growth in weight and morphometric characteristics. Two families showed highest (P<0.05) weights at both 133 days (family AA10: 743.2 g; family AA16: 741.2 g) and 181 days (family AA10: 1,422.1 g; family AA16: 1,393.4 g) of the experiment. In both experimental periods, the males showed a heavier weight, with the greatest contrast between the sexes occurring at 181 days. The analysis of the three most contrasting families (AA1, AA9 and AA14) showed that the asymptotic value for weight was higher (P<0.05) in family AA9 (3,926.3 g) than in family AA14 (3,251.6 g), but specific growth rate and age at the inflection point did not differ significantly between families. In conclusion, two of the 20 families were superior; males exhibited a greater growth, mainly in the period of 181 days; and the growth curve differed between the families, especially for asymptotic weight.
Keywords:
fish genetics; Gompertz; fish genetic improvement; animal husbandry; Oreochromis niloticus
Resumo
A seleção pode impactar a forma de crescimento, mudando o desempenho e os valores assintóticos. No entanto, existem poucas informações sobre o crescimento das famílias em programas de criação de peixes. O objetivo deste estudo foi examinar o desempenho e as curvas de crescimento de famílias de tilápia-do-Nilo AquaAmérica. Foram avaliadas 20 famílias AquaAmérica cultivadas em tanques-rede (13,5 m3) por 181 dias. O modelo de regressão não linear de Gompertz foi ajustado aos dados pelo método dos mínimos quadrados ponderados, tomando o inverso da variância do peso nas diferentes famílias e nas diferentes idades como variável de ponderação. O modelo foi ajustado para descrever o crescimento em peso e características morfométricas. Duas famílias apresentaram pesos maiores (P <0,05) em 133 dias (família AA10: 743,2 g; família AA16: 741,2 g) e 181 dias (família AA10: 1422,1 g; família AA16: 1393,4 g) de experimento em relação a outras famílias. Em ambos os períodos experimentais, os machos apresentaram maior peso, com maior contraste entre os sexos ocorrendo aos 181 dias. A análise das três famílias mais contrastantes (AA1, AA9 e AA14) mostrou que o valor assintótico para o peso foi maior (P <0,05) na família AA9 (3926,3 g) do que na família AA14 (3251,6 g), mas a taxa de crescimento específica e a idade no ponto de inflexão não diferiu significativamente entre as famílias. Em conclusão, duas das 20 famílias eram muito superiores; machos exibiram um maior crescimento, principalmente no período de 181 dias; e a curva de crescimento diferiu entre as famílias, principalmente quanto ao peso assintótico.
Palavras-chave:
genética de peixes; Gompertz; melhoramento genético de peixes; produção animal; Oreochromis niloticus
1. Introduction
Nile tilapia (Orechromis niloticus) was the third most farmed aquaculture species in the world in 2017 (FAO, 2020FOOD AND AGRICULTURE ORGANIZATION – FAO, 2020 [viewed 10 September 2020]. FishStatJ - Software for Fishery and Aquaculture Statistical Time Series [online]. Available from: http://www.fao.org/fishery/statistics/software/fishstatj/en
http://www.fao.org/fishery/statistics/so...
), and the first most cultivated species in Brazil in 2019, which placed the country as the world's fourth largest producer of the species (Peixe BR, 2020PEIXE BR, 2020. Anuário 2020 Peixe BR da Piscicultura. São Paulo: Peixe Br.). Nile tilapia represents the only aquatic organism for which consolidated breeding programs exist in Brazil. This is important for the development of aquaculture, considering that selective breeding in fish can provide gains of 8 to 12% per generation of selection (Nguyen, 2016NGUYEN, H.N., 2016. Genetic improvement for important farmed aquaculture species with a reference to carp, tilapia and prawns in Asia: achievements, lessons and challenges. Fish and Fisheries, vol. 17, no. 2, pp. 483-506. http://dx.doi.org/10.1111/faf.12122.
http://dx.doi.org/10.1111/faf.12122...
).
Selective breeding in Nile tilapia is recent in Brazil, with the first record of the practice being reported only in 2002, when the Supreme variety (GenoMar Supremo Tilápia) was imported, focusing on the exclusive sale of monosexual individuals (Zimmermann and Fitzsimmons, 2004ZIMMERMANN, S. and FITZSIMMONS, K., 2004. Tilapicultura intensiva. In: J.E.P. CYRINO, E.C. URBINATI, D.M. FRACALOSSI and N. CASTAGNOLLI, eds. Tópicos especiais em piscicultura de água doce tropical intensiva. São Paulo: Sociedade Brasileira de Aqüicultura e Biologia Aquática/TecArt, pp. 239-266.). The GIFT (Genetically Improved Farmed Tilapia) variety was subsequently introduced in 2005 (30 families), which were imported by the State University of Maringá (UEM), located in Maringá - PR, in partnership with the World Fish Center (Garcia et al., 2017GARCIA, A.L.S., DE OLIVEIRA, C.A.L., KARIM, H.M., SARY, C., TODESCO, H. and RIBEIRO, R.P., 2017. Genetic parameters for growth performance, fillet traits, and fat percentage of male Nile tilapia (Oreochromis niloticus). Journal of Applied Genetics, vol. 58, no. 4, pp. 527-533. http://dx.doi.org/10.1007/s13353-017-0413-6. PMid:28988364.
http://dx.doi.org/10.1007/s13353-017-041...
). This variety originated from the crossing of four wild African varieties (Ghana, Egypt, Kenya and Senegal) to four domesticated Asian varieties (Israel, Singapore, Taiwan and Thailand) (Eknath et al., 2007EKNATH, A.E., BENTSEN, H.B., PONZONI, R.W., RYE, M., NGUYEN, N.H., THODESEN, J. and GJERDE, B., 2007. Genetic improvement of farmed tilapias: composition and genetic parameters of a synthetic base population of Oreochromis niloticus for selective breeding. Aquaculture (Amsterdam, Netherlands), vol. 273, no. 1, pp. 1-14. http://dx.doi.org/10.1016/j.aquaculture.2007.09.015.
http://dx.doi.org/10.1016/j.aquaculture....
). The AquaAmérica variety is one of the most recently developed in Brazil, having been created in 2012 in Alfenas - MG, and released on the market in 2014 (Oliveira et al., 2016OLIVEIRA, C.A.L., RIBEIRO, R.P., YOSHIDA, G.M., KUNITA, N.M., RIZZATO, G.S., OLIVEIRA, S.N., SANTOS, A.I. and NGUYEN, H.N., 2016. Correlated changes in body shape after five generations of selection to improve growth rate in a breeding program for Nile tilapia Oreochromis niloticus in Brazil. Journal of Applied Genetics, vol. 57, no. 4, pp. 487-493. http://dx.doi.org/10.1007/s13353-016-0338-5. PMid:26810351.
http://dx.doi.org/10.1007/s13353-016-033...
). This variety was developed from families of GIFT and crossed with the Chitralala and Bouaké varieties, introduced in 1996 and 1971, respectively (Garcia et al., 2017GARCIA, A.L.S., DE OLIVEIRA, C.A.L., KARIM, H.M., SARY, C., TODESCO, H. and RIBEIRO, R.P., 2017. Genetic parameters for growth performance, fillet traits, and fat percentage of male Nile tilapia (Oreochromis niloticus). Journal of Applied Genetics, vol. 58, no. 4, pp. 527-533. http://dx.doi.org/10.1007/s13353-017-0413-6. PMid:28988364.
http://dx.doi.org/10.1007/s13353-017-041...
).
In Nile tilapia, selective breeding has been practiced by combining between- and within-family selection, which consists of selecting a limited number of individuals per family while keeping representatives of the largest possible number of families in future generations, focusing on weight gain (Hamzah et al., 2014HAMZAH, A., PONZONI, R.W., NGUYEN, N.H., KHAW, H.L., YEE, H.Y. and NOR, S.A.M., 2014 [viewed 10 September 2020]. Genetic evaluation of the Genetically Improved Farmed Tilapia (GIFT) strain over ten generations of selection in Malaysia. Journal Tropical Agricultural Science [online]. vol. 37, no. 4, pp. 411-429. Available from: https://hdl.handle.net/20.500.12348/65
https://hdl.handle.net/20.500.12348/65...
; Nguyen, 2016NGUYEN, H.N., 2016. Genetic improvement for important farmed aquaculture species with a reference to carp, tilapia and prawns in Asia: achievements, lessons and challenges. Fish and Fisheries, vol. 17, no. 2, pp. 483-506. http://dx.doi.org/10.1111/faf.12122.
http://dx.doi.org/10.1111/faf.12122...
). Therefore, although some families from the breeding program stand out, they are maintained in the program as a way of controlling inbreeding (Zardin et al, 2019ZARDIN, A.M.S.O., OLIVEIRA, C.A.L., OLIVEIRA, S.N., YOSHIDA, G.M., ALBUQUERQUE, D.T., CAMPOS, C.M. and RIBEIRO, R.P., 2019. Growth curves by Gompertz nonlinear regression model for male and female Nile tilapias from different genetic groups. Aquaculture (Amsterdam, Netherlands), vol. 511, pp. 734243. http://dx.doi.org/10.1016/j.aquaculture.2019.734243.
http://dx.doi.org/10.1016/j.aquaculture....
). In this sense, evaluating the families with the greatest growth potential is essential. For this purpose, the Gompertz model is the most suitable to determine the growth curve of Nile tilapia of the GIFT variety (Amâncio et al., 2014AMANCIO, A.L.L., SILVA, J.H.V., FERNANDES, J.B.K., SAKOMURA, N.K. and CRUZ, G., 2014. Use of mathematical models in the study of bodily growth in GIFT strain Nile tilapia. Ciência Agronômica, vol. 45, no. 2, pp. 257-266. http://dx.doi.org/10.1590/S1806-66902014000200005.
http://dx.doi.org/10.1590/S1806-66902014...
). This model has been used to determine the growth curve for GIFT Nile tilapia (Zardin et al., 2019ZARDIN, A.M.S.O., OLIVEIRA, C.A.L., OLIVEIRA, S.N., YOSHIDA, G.M., ALBUQUERQUE, D.T., CAMPOS, C.M. and RIBEIRO, R.P., 2019. Growth curves by Gompertz nonlinear regression model for male and female Nile tilapias from different genetic groups. Aquaculture (Amsterdam, Netherlands), vol. 511, pp. 734243. http://dx.doi.org/10.1016/j.aquaculture.2019.734243.
http://dx.doi.org/10.1016/j.aquaculture....
) and tambaqui (Colossoma macropum) from the breeding program (Marcos et al., 2020MARCOS, R., CORRÊA-FILHO, R.A.C., ABREU, J.S., SERAPHIM, G.N., SILVA, A.C.C., FORNARI, D.C., RIBEIRO, R.P., PIRES, L.B., MARTINS, T.X. and POVH, J.A., 2020. Growth curve of selectively Bred Tambaqui (Colossoma macropomum) reared in different environments. Journal of Agricultural Studies, vol. 8, no. 3, pp. 586-600. http://dx.doi.org/10.5296/jas.v8i3.16379.
http://dx.doi.org/10.5296/jas.v8i3.16379...
). However, there are no studies on the growth curve of different families of AquaAmérica, the most recent variety produced currently in Brazil. This study proposes to examine the performance and growth curves of Nile tilapia from different families of the AquaAmérica variety.
2. Materials and methods
2.1. Fish and location
Fingerlings were obtained from the breeding program of the Nile tilapia species, AquaAmérica variety, located in the municipality of Alfenas, MG, Brazil. The Nile tilapia AquaAmérica variety was created in Brazil in 2012, from the GIFT variety previously crossed with the Chitralada and Bouaké varieties, which were introduced in 1996 and 1971, respectively (Oliveira et al., 2016OLIVEIRA, C.A.L., RIBEIRO, R.P., YOSHIDA, G.M., KUNITA, N.M., RIZZATO, G.S., OLIVEIRA, S.N., SANTOS, A.I. and NGUYEN, H.N., 2016. Correlated changes in body shape after five generations of selection to improve growth rate in a breeding program for Nile tilapia Oreochromis niloticus in Brazil. Journal of Applied Genetics, vol. 57, no. 4, pp. 487-493. http://dx.doi.org/10.1007/s13353-016-0338-5. PMid:26810351.
http://dx.doi.org/10.1007/s13353-016-033...
; Garcia et al., 2017GARCIA, A.L.S., DE OLIVEIRA, C.A.L., KARIM, H.M., SARY, C., TODESCO, H. and RIBEIRO, R.P., 2017. Genetic parameters for growth performance, fillet traits, and fat percentage of male Nile tilapia (Oreochromis niloticus). Journal of Applied Genetics, vol. 58, no. 4, pp. 527-533. http://dx.doi.org/10.1007/s13353-017-0413-6. PMid:28988364.
http://dx.doi.org/10.1007/s13353-017-041...
). The selective-breeding program for the AquaAmérica variety developed in Brazil adopts the weight at harvest and filet yield of fish grown in net cages and hatcheries as selection criteria (Garcia et al., 2017GARCIA, A.L.S., DE OLIVEIRA, C.A.L., KARIM, H.M., SARY, C., TODESCO, H. and RIBEIRO, R.P., 2017. Genetic parameters for growth performance, fillet traits, and fat percentage of male Nile tilapia (Oreochromis niloticus). Journal of Applied Genetics, vol. 58, no. 4, pp. 527-533. http://dx.doi.org/10.1007/s13353-017-0413-6. PMid:28988364.
http://dx.doi.org/10.1007/s13353-017-041...
). This breeding program has been active since 2012, through a selection process that results in the fish (grandparents) that will produce the breeding stock at each cycle and, at the same time (annually), the fish that will produce the next selection generation (nucleus). In planning matings for the production of broodfish, producers adopt inbreeding control methods to prevent the mating of related animals until the third generation.
The experiment was conducted in net cages that were allocated to a 24-ha dam on a fish farm located in Nova Alvorada do Sul - MS, Brazil (21°21'06.2” S 54°20'56.2” W). The fingerlings were acclimated for 15 days in 20-mm-mesh net cages (13.5 m3) spaced 2 m apart. The total experimental period was 181 days, from August (winter) to January (summer).
2.2. Experimental unit and measured variables
A total of 300 fish from 20 AquaAmérica families (15 fish per family), with an average weight of 77.4 ± 18.4 g, were evaluated. These were identified with a microchip and allocated to a net cage at a density of 50 fish m-3.
After the adaptation, five biometric assessments were performed for a total experimental period of 181 days (fifth assessment). Before the biometric measurements, the fish were fasted for 24 h and anesthetized with eugenol solution (50 mg L-1), as approved by the ethics committee of the institution (approval no. 644/2014).
Weight (g) and the following morphometric traits were measured: total length (from the anterior to the posterior end in the longitudinal direction of the fish), standard length (from the anterior end to the beginning of the caudal fin), body height H1 (at the beginning of the dorsal fin); body height H2 (in the middle of the dorsal fin), body height H3 (at the beginning of the anal fin - near the end of the dorsal fin), body height H4 (in the middle of the caudal peduncle), body width W1 (at the beginning of the dorsal fin), body width W2 (in the middle of the dorsal fin), body width W3 (at the beginning of the anal fin), body width W4 (in the middle of the caudal peduncle), head height (from the lower portion to the upper portion of the head), head length (from the anterior end to the posterior end of the head), head width (immediately behind the eye region), torso length (calculated as the difference between the measurements of standard length and head length).
2.3. Water quality and feed
The fish were fed extruded diet twice daily (09h00 and 16h00). Pellets of 2 to 3 mm, 3 to 5 mm and 6 to 8 mm were used in the weight stages of 30 to 100 g, 100 to 300 g and >300 g, respectively. These contained 40, 32 and 32% crude protein; 88, 88 and 88% dry matter; 14, 14 and 14% mineral matter; 11, 7.5 and 6.5% ether extract; 2.5, 3.8 and 4.0% crude fiber; 3.5, 3.5 and 4.0% calcium; and 2.0, 2.0 and 2.0% phosphorus, respectively. The amount of feed offered to the fish was adjusted after each biometric assessment, ranging from 8% to 2% of the total biomass for the initial and final phases, respectively.
Water samples were harvested monthly from the dam at a depth of 50 cm at three points near the net cages. The temperature, pH and dissolved oxygen values, as obtained using a multiparameter instrument (YSI ProPlus), were 25.8 ± 1.6 ºC, 7.4 ± 0.2 and 7.9 ± 0.2 mg L-1, respectively. The alkalinity of carbonates and total ammonium nitrogen, as obtained by the Standard Methods methodology, were 15.0 ± 1.5 and 0.11 ± 0.01 mg L-1, respectively.
2.4. Statistical analysis
The data of all traits measured at biometric assessments four (133 days of experiment) and five (181 days of experiment) were subjected to analysis of variance weighted by the inverse of the variance of the families, considering the family, sex and family × sex interaction as sources of variation and initial weight as a covariate (biometric assessment 1). Analysis of variance was performed using the GLM procedure of SAS version 9.1. Means were separated by the Scott-Knott clustering algorithm using the Scott-Knott package of R software, at the 5% significance level.
For the analysis of the growth curves, three families were chosen, which differed at biometric assessments four (133 days of experiment) and five (181 days of experiment) and which had larger numbers of individuals as well as similar sex ratios (1:1). To describe the growth curves, the nonlinear Gompertz regression model (Fialho, 1999FIALHO, F.B., 1999. Interpretação da curva de crescimento de Gompertz. Concórdia: Embrapa - CNPSA, 4 p.) was adopted, by applying the following Equation 1:
where
𝐲𝐢 - weight (g) or size (cm) estimated at age t;
𝑨 - asymptotic weight (g) or size (cm) when t tends to plus infinite, i.e., this parameter can be
interpreted as the maximum weight or size in the cultivation conditions;
𝑩 - relative growth at the inflection point (g day-1 per g of fish or cm day-1 per cm of fish);
𝒄 - age at the inflection point (days);
𝒕 - age (days);
e - 2.718281828459.
The nonlinear Gompertz regression model was fitted to the data by the weighted least squares method, taking the inverse of the variance of weight in different families and at different ages as the weighting variable. The model was fitted to describe the growth of weight, total length, standard length, torso length, head length, body height measured at the beginning of the dorsal fin (H1) and body width measured at the beginning of the dorsal fin (W1).
The curve parameters were estimated using the NLIN procedure of SAS statistical software version 9.1, by applying the Marquerdt method. To test the equality of parameters and identity of non-linear models, the likelihood test with approximation by X2 distribution (chi-square) was performed, following Regazzi and Silva (2004)REGAZZI, A.J. and SILVA, C., 2004. Teste para verificar a igualdade de parâmetros e a identidade de modelos de regressão não-linear. I. Dados no delineamento inteiramente casualizado. Revista de Matemática e Estatística, vol. 22, no. 3, pp. 33-45..
3. Results
Families AA10 and AA16 showed heavier (P<0.05) weights than the other families at 133 days (Table 1) and 181 days of experiment (Table 2). Weight increased almost twice in the period from 133 to 181 days of experiment, in some families (AA2, AA10 and AA16).
Weight and morphometric traits of families of Nile tilapia (Oreochromis niloticus) AquaAmérica variety after 133 days of experiment (biometric assessment 4).
Weight and morphometric traits of families of Nile tilapia (Oreochromis niloticus) variety AquaAmérica after 181 days of experiment (biometric assessment 5).
Body length measurements (total, standard and torso) were highest (P<0.05) in family AA16 (some families did not differ from family AA16) at 133 days of experiment (Table 1). The same was observed at 181 days of experiment, except for total length, which was greatest in family AA19 (Table 2).
At 133 days of experiment, the body heights (H1, H2, H3 and H4) were greatest (P<0.05) in families AA10 and AA16 (which did not differ from family AA9 for body height measured at the beginning of the anal fin - H3), except for body height measured in the middle of the caudal peduncle (H4), which did not differ between the families (Table 1). On the other hand, at 181 days of the experiment, families AA10 and AA19 had the greatest (P<0.05) body height measured at the beginning of the dorsal fin (H1) and family AA16 had the greatest (P<0.05) body height measured in the middle of the dorsal fin (H2) and body height measured in the middle of the caudal peduncle (H4). Body height measured at the beginning of the anal fin (H3) did not differ between the treatments (Table 2).
Body widths (W1, W2, W3 and W4) at 133 days were greatest (P<0.05) in family AA19 (which did not differ from families AA16, AA5 and AA20 for body width measured at the beginning of the dorsal fin - W1), except body width measured in the middle of the caudal peduncle (W4), which did not differ between the families (Table 1). On the other hand, at 181 days, only body width measured at the beginning of the dorsal fin (W1) and body width measured in the middle of the dorsal fin (W2) differed significantly, with higher (P<0.05) values measured in family AA10 (Table 2).
For the head measurements, only head height differed between the families at 131 days (Table 1). Overall, the families with the highest (P<0.05) body weight, length and height also had the greatest head height (Table 1). Conversely, head height did not differ between the families at 181 days of experiment, but head length and width were greatest in family AA16 (which did not differ from families AA10, AA9, AA2 and AA20 for head length) (Table 2).
At the fourth and fifth biometric assessments, higher (P<0.05) values were obtained in the males in relation to the females for most of the evaluated traits, except for body height measured at the beginning of the dorsal fin (H1), body widths (W1, W2, W3 and W4), head length and head width at the fourth assessment; and body width measured at the beginning of the dorsal fin (W1) and in the middle of the caudal peduncle (W4) at the fifth assessment (Table 3). There was no interaction effect between sex and family for the evaluated traits.
Weight and morphometric traits of males and females of families of Nile tilapia (Oreochromis niloticus) AquaAmérica variety.
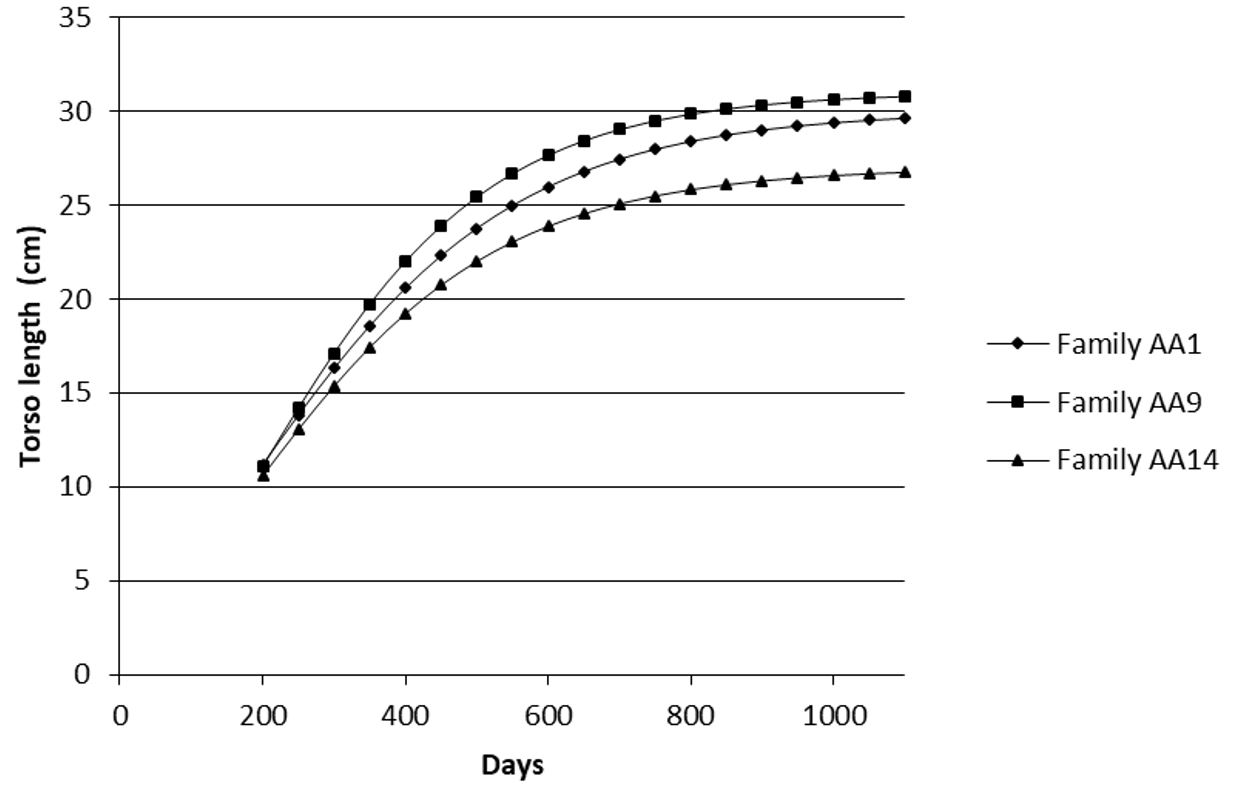
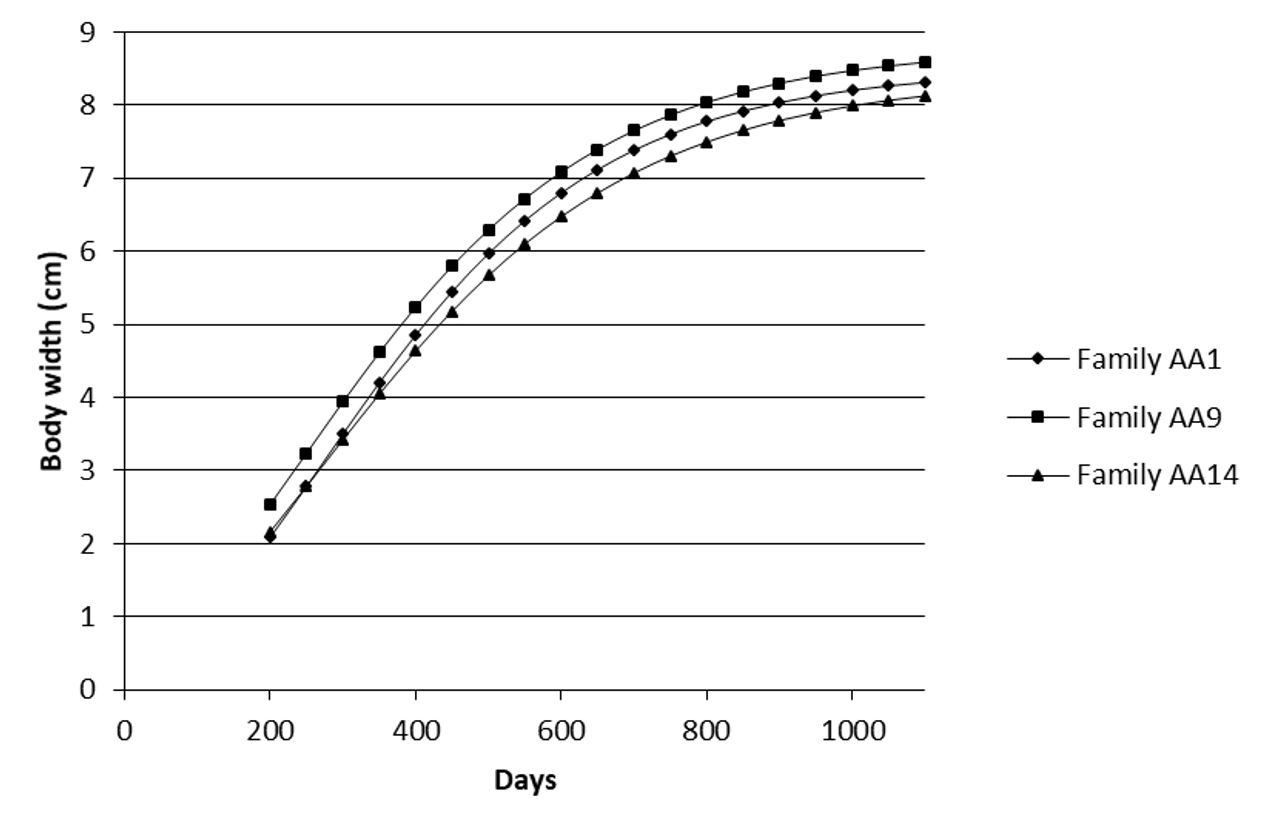
In the analysis of the curves, the most contrasting families were families AA9 (greatest growth) and AA14 (smallest growth). Family AA1 showed intermediate growth. The traits of weight (Figure 1), total length (Figure 2), standard length (Figure 3), torso length (Figure 4) and body width (Figure 5) showed a distinct growth curve between families AA1, AA9 and AA14 (Table 4).

Growth curve for weight (g) as a function of age (days) in three contrasting families (Family AA1, Family AA9 and Family AA14) of Nile tilapia (Oreochromis niloticus) AquaAmérica variety.

Growth curve for total length (cm) as a function of age (days) in three contrasting families (Family AA1, Family AA9 and Family AA14) of Nile tilapia (Oreochromis niloticus) AquaAmérica variety.

Growth curve for standard length (cm) as a function of age (days) in three contrasting families (Family AA1, Family AA9 and Family AA14) of Nile tilapia (Oreochromis niloticus) AquaAmérica variety.

Growth curve for torso length (cm) as a function of age (days) in three contrasting families (Family AA1, Family AA9 and Family AA14) of Nile tilapia (Oreochromis niloticus) AquaAmérica variety.

Growth curve for body width (cm) as a function of age (days) in three contrasting families (Family AA1, Family AA9 and Family AA14) of Nile tilapia (Oreochromis niloticus) AquaAmérica variety.
Gompertz model parameters obtained for the growth curve of weight and morphometric traits of families AA1, AA9 and AA14 of Nile tilapia (Oreochromis niloticus) AquaAmérica variety.
The analysis of the curves of these three families revealed a higher (P<0.05) asymptotic value (parameter A) for family AA9 than family AA14 for all variables, except body height measured at the beginning of the dorsal fin (H1) and head length. A great difference was observed in the asymptotic value for weight in family AA9 (3,926.3 g) as compared with family AA14 (3,251.6 g) (Table 4).
The growth curves did not differ significantly between the families in terms of relative growth rate at the inflection point (parameter B) for the evaluated traits. The exception was standard length, which was higher (P<0.05) in family AA14 (0.00620 cm day-1 per cm of fish) than in family AA9 (0.00532 cm day-1 per cm of fish) (Table 4).
A higher (P<0.05) age at the inflection point was observed for the standard length in family AA9 (231 days) as compared with families AA1 and AA14 (210 days). The opposite was observed for body width measured at the beginning of the dorsal fin (W1), for which age at the inflection point was greater (P<0.05) in families AA1 and AA14 (274 days) than in family AA9 (250 days) (Table 4).
4. Discussion
Selective breeding in fish can provide weight gains of 8 to 12% per generation (Nguyen, 2016NGUYEN, H.N., 2016. Genetic improvement for important farmed aquaculture species with a reference to carp, tilapia and prawns in Asia: achievements, lessons and challenges. Fish and Fisheries, vol. 17, no. 2, pp. 483-506. http://dx.doi.org/10.1111/faf.12122.
http://dx.doi.org/10.1111/faf.12122...
). It is common for some families of breeding programs to stand out and. Consequently, these are not eliminated from the program to prevent increases in inbreeding (Zardin et al., 2019ZARDIN, A.M.S.O., OLIVEIRA, C.A.L., OLIVEIRA, S.N., YOSHIDA, G.M., ALBUQUERQUE, D.T., CAMPOS, C.M. and RIBEIRO, R.P., 2019. Growth curves by Gompertz nonlinear regression model for male and female Nile tilapias from different genetic groups. Aquaculture (Amsterdam, Netherlands), vol. 511, pp. 734243. http://dx.doi.org/10.1016/j.aquaculture.2019.734243.
http://dx.doi.org/10.1016/j.aquaculture....
). Identifying the families with superior performance and growth is essential for targeting the fish destined for fattening in the production sector. In the present study, we clearly see a great difference in performance and some differences in the growth curve of the 20 evaluated families of the AquaAmérica variety.
Considering that the experiment was conducted largely in the winter, the final weight obtained can be deemed satisfactory for most families, especially for families AA10 and AA16, which had the heaviest weight. The great increase in weight from the fourth to the fifth biometric assessment can be explained by the increase in water temperature as the winter approached its end. This is reasonable, considering that the ideal water temperature for Nile tilapia is in the range between 26 and 32 ºC (El-Sayed, 2006EL-SAYED, E.M., 2006. Tilapia culture. Cambridge: CABI publishing, 277 p. http://dx.doi.org/10.1079/9780851990149.0000.
http://dx.doi.org/10.1079/9780851990149....
). A lower final weight was described by Marengoni et al. (2015)MARENGONI, N.G., MACHADO, L.M.C., OLIVEIRA, C.A.L., YOSHIDA, G.M., KUNITA, N.M. and RIBEIRO, R.P., 2015. Características morfológicas e desempenho de crescimento de monossexo macho de tilápia da variedade GIFT e Saint Peter®. Semina: Ciências Agrárias, vol. 36, no. 5, pp. 3399. http://dx.doi.org/10.5433/1679-0359.2015v36n5p399.
http://dx.doi.org/10.5433/1679-0359.2015...
, who obtained 338.28 g over a period of 160 days of cultivation of the GIFT variety. The observed difference in weight between the studies with Nile tilapia is due to genetics - varieties (Marengoni et al., 2015MARENGONI, N.G., MACHADO, L.M.C., OLIVEIRA, C.A.L., YOSHIDA, G.M., KUNITA, N.M. and RIBEIRO, R.P., 2015. Características morfológicas e desempenho de crescimento de monossexo macho de tilápia da variedade GIFT e Saint Peter®. Semina: Ciências Agrárias, vol. 36, no. 5, pp. 3399. http://dx.doi.org/10.5433/1679-0359.2015v36n5p399.
http://dx.doi.org/10.5433/1679-0359.2015...
), environment (Oliveira et al., 2017OLIVEIRA, S.N., RIBEIRO, R.P., OLIVEIRA, C.A.L., ALEXANDRE, L., OLIVEIRA, A.M.S., LOPERA-BARRERO, N.M., SANTANDER, V.F.A. and SANTANA, R.A.C., 2017. Interactive effects of genotype x environment on the live weight of GIFT Nile tilapias. Anais da Academia Brasileira de Ciências, vol. 89, no. 4, pp. 2931-2943. http://dx.doi.org/10.1590/0001-3765201720150629. PMid:29236869.
http://dx.doi.org/10.1590/0001-376520172...
) and density and/or production system (Ribeiro, 2001RIBEIRO, R.P., 2001. Construção de tanques. In: S. ZIMMERMANN, H.L.M. MOREIRA, L. VARGAS and R.P. RIBEIRO, eds. Fundamentos da moderna aquicultura. Canoas: ULBRA, pp. 45-52.).
The greater weight found in families AA10 and AA16 at the fourth and fifth biometric assessments indicates the superiority of these families over the others, especially family AA8 at the fourth biometric assessment (37.2% lower than family AA10) and family AA6 at the fifth assessment (37.1% lower than family AA10). This result shows a great contrast in weight between different families of the same selection generation, warranting the need to evaluate families destined for the production sector. Although it is important to maintain all families in the breeding program to minimize the increase in inbreeding, only the families with the highest performance are destined for the production sector. Moreover, families can perform differently in a given production environment (Oliveira et al., 2017OLIVEIRA, S.N., RIBEIRO, R.P., OLIVEIRA, C.A.L., ALEXANDRE, L., OLIVEIRA, A.M.S., LOPERA-BARRERO, N.M., SANTANDER, V.F.A. and SANTANA, R.A.C., 2017. Interactive effects of genotype x environment on the live weight of GIFT Nile tilapias. Anais da Academia Brasileira de Ciências, vol. 89, no. 4, pp. 2931-2943. http://dx.doi.org/10.1590/0001-3765201720150629. PMid:29236869.
http://dx.doi.org/10.1590/0001-376520172...
).
Overall, the families with heavier weights also had a larger body size (total, standard and torso) at 133 and 181 days, except family AA19 for total length at 181 days. Likewise, body heights H1, H2, H3 and H4 were also higher in the families that exhibited greater weights (families AA10 and AA16). At 133 days, this increase was seen for H1, H2 and H3; and at 181 days, body height H1 increased in family AA10, and body heights H2 and H4 in family AA16. These results demonstrate the relationship between these morphometric traits and weight.
The greater body width W1 of families AA5, AA16, AA19 and AA20 and body widths W2 and W3 in family AA19 at 133 days; and the greater body widths W2 and W3 in family AA19 and body widths W1 and W2 in family AA10 at 181 days indicate a change in body widths between families from the fourth to the fifth biometric assessment. Such considerations are of paramount importance for the fish industry, as body width is highly correlated with the yield of the fillet, the commercial cut of greatest economic value (Silva et al., 2009SILVA, F.V., SARMENTO, N.L.A.F., VIEIRA, J.S., TESSITORE, A.J.A., OLIVEIRA, L.L.S. and SARAIVA, E.P., 2009. Características morfométricas, rendimentos de carcaça, filé, vísceras e resíduos em tilápias-do-nilo em diferentes faixas de peso. Revista Brasileira de Zootecnia, vol. 38, no. 8, pp. 1407-1412. http://dx.doi.org/10.1590/S1516-35982009000800003.
http://dx.doi.org/10.1590/S1516-35982009...
). However, the families with the widest bodies at 133 and 181 days also had a larger head size (height, width and length), a trait that may be inversely related to fillet yield.
Males exhibited higher values for weight and for most traits than females, at both the fourth (133 days) and fifth (181 days) biometric measurements. However, at 133 days, the difference in weight between males and females was only 7%, whereas at 181 days this difference was 17.6%. This contrast between periods is possibly due to the sexual maturity of the females. Oliveira et al. (2013)OLIVEIRA, A.M.S., OLIVEIRA, C.A.L., MATSUBARA, B.J.A., OLIVEIRA, S.N., KUNITA, N.M., YOSHIDA, G.M. and RIBEIRO, R.P., 2013. Growth patterns of male and female of Nile tilapia (Oreochromis niloticus) GIFT variety. Semina: Ciências Agrárias, vol. 34, pp. 1891-1900. http://dx.doi.org/10.5433/1679-0359.2013v34n4p1891.
http://dx.doi.org/10.5433/1679-0359.2013...
observed similar growth in males and females of the GIFT variety up to 165 days. After that period, the males exhibited a greater growth, which the authors attributed to the sexual maturity of females, although their asymptotic weight was 37.4% lower than that of the males. Zardin et al. (2019)ZARDIN, A.M.S.O., OLIVEIRA, C.A.L., OLIVEIRA, S.N., YOSHIDA, G.M., ALBUQUERQUE, D.T., CAMPOS, C.M. and RIBEIRO, R.P., 2019. Growth curves by Gompertz nonlinear regression model for male and female Nile tilapias from different genetic groups. Aquaculture (Amsterdam, Netherlands), vol. 511, pp. 734243. http://dx.doi.org/10.1016/j.aquaculture.2019.734243.
http://dx.doi.org/10.1016/j.aquaculture....
also observed higher asymptotic values in males after 165 days, in a comparison of males and females with high, medium and low estimated breeding values (EBV). These authors observed that the high-EBV females had a higher asymptotic value than the medium-EBV females, suggesting it is possible to minimize sexual dimorphism with the use of high-EBV females depending on the response to selection in both sexes. This is possible, since, in the GIFT variety, males respond differently from females in terms of body conformation. Therefore, selection could be performed separately between males and females (Reis-Neto et al., 2017REIS-NETO, R.V., OLIVEIRA, C.A.L., RIBEIRO, R.P., FREITAS, R.T.F., ALLAMAN, I.B. and OLIVEIRA, S.N., 2017. Genetic differences between sexes for morphometric traits of GIFT tilapia. Aquaculture Research, vol. 48, no. 3, pp. 1-9. http://dx.doi.org/10.1111/are.12966.
http://dx.doi.org/10.1111/are.12966...
).
The higher asymptotic value (parameter A) for weight observed in family AA9 (3,926.3 g) as compared with family AA14 (3,251.6 g) reveals a great difference between the families (674.7 g) of the same selection generation. This shows that families with higher and lower growth potential exist in the same selection generation. It is noteworthy that even in this situation, the specific growth rate (parameter B) and the age at the inflection point (parameter C) for weight were similar between the most contrasting families evaluated (families AA1, AA9 and AA14), indicating a similar growth pattern between these families, for these parameters. This scenario was also described by Zardin et al. (2019)ZARDIN, A.M.S.O., OLIVEIRA, C.A.L., OLIVEIRA, S.N., YOSHIDA, G.M., ALBUQUERQUE, D.T., CAMPOS, C.M. and RIBEIRO, R.P., 2019. Growth curves by Gompertz nonlinear regression model for male and female Nile tilapias from different genetic groups. Aquaculture (Amsterdam, Netherlands), vol. 511, pp. 734243. http://dx.doi.org/10.1016/j.aquaculture.2019.734243.
http://dx.doi.org/10.1016/j.aquaculture....
, who observed very different growth for both males and females, mainly for the asymptotic value, between high-, medium- and low-EBV families. However, the authors saw a difference in age at the inflection point in the families with higher EBV as compared with medium- and low-EBV families, for both males and females.
The same pattern for the asymptotic value was observed for the body length measurements (total, standard and torso), reflecting a great superiority of family AA9 over family AA14. The lower specific growth rate and the higher age at the inflection point in family AA9 in relation to family AA14 indicate a more prolonged continuous growth in the former family. Higher specific growth rates mean the growth is more concentrated around the inflection point, increasing the maximum growth rate. As a result, the initial and final growths are slower. In contrast, lower specific growth rates indicate a growth distributed more evenly over time (Fialho, 1999FIALHO, F.B., 1999. Interpretação da curva de crescimento de Gompertz. Concórdia: Embrapa - CNPSA, 4 p.). A similar behavior was observed by Zardin et al. (2019)ZARDIN, A.M.S.O., OLIVEIRA, C.A.L., OLIVEIRA, S.N., YOSHIDA, G.M., ALBUQUERQUE, D.T., CAMPOS, C.M. and RIBEIRO, R.P., 2019. Growth curves by Gompertz nonlinear regression model for male and female Nile tilapias from different genetic groups. Aquaculture (Amsterdam, Netherlands), vol. 511, pp. 734243. http://dx.doi.org/10.1016/j.aquaculture.2019.734243.
http://dx.doi.org/10.1016/j.aquaculture....
for the weight trait (the authors did not evaluate morphometric traits), in which some families with higher EBV also had a more advanced age at the inflection point but no differences in specific growth rate.
Although body height and head length did not show changes in growth pattern between the most contrasting families, body width showed a higher asymptotic value in family AA9 than in families AA1 and AA14, corroborating the superiority of growth in family AA9. On the other hand, age at the inflection point differed from the result observed for standard length, with a younger age occurring in family AA9 as compared with the others. This result reveals that the growth patterns for body weight, length and width are different; with a greater earliness occurring in body width as compared with standard length, (age at the inflection point for weight did not differ between the families).
Fish exhibit continuous growth as long as they have available feed and space to grow, since their growth pattern may vary with the carrying capacity of the production system (Seraphim et al., 2020SERAPHIM, G.N., CORRÊA-FILHO, R.A.C., NUNES, A.L., PIRES, L.B., SILVA, T.G., FERREIRA, Y.A., ALMEIDA, L.C., MARTINS, T.X., LOPERA-BARRERO, N.M., SPICA, L.N. and POVH, J.A., 2020. Growth curve of pacu and the patinga hybrid farmed in a semi-intensive system. Semina: Ciências Agrárias, vol. 41, pp. 2285-2296. http://dx.doi.org/10.5433/1679-0359.2020v41n5supl1p2285.
http://dx.doi.org/10.5433/1679-0359.2020...
). This is corroborated by the works with Nile tilapia developed by Amâncio et al. (2014)AMANCIO, A.L.L., SILVA, J.H.V., FERNANDES, J.B.K., SAKOMURA, N.K. and CRUZ, G., 2014. Use of mathematical models in the study of bodily growth in GIFT strain Nile tilapia. Ciência Agronômica, vol. 45, no. 2, pp. 257-266. http://dx.doi.org/10.1590/S1806-66902014000200005.
http://dx.doi.org/10.1590/S1806-66902014...
, who found an asymptotic value of 763.6 g (25 fish m-3), and by Zardin et al. (2019)ZARDIN, A.M.S.O., OLIVEIRA, C.A.L., OLIVEIRA, S.N., YOSHIDA, G.M., ALBUQUERQUE, D.T., CAMPOS, C.M. and RIBEIRO, R.P., 2019. Growth curves by Gompertz nonlinear regression model for male and female Nile tilapias from different genetic groups. Aquaculture (Amsterdam, Netherlands), vol. 511, pp. 734243. http://dx.doi.org/10.1016/j.aquaculture.2019.734243.
http://dx.doi.org/10.1016/j.aquaculture....
, who observed the asymptotic values of 1,056.0 g for high-EBV males and 716.0 for high-EBV females (100 fish m-3). It is interesting to note that genetics also has an effect, as demonstrated in the study of Zardin et al. (2019)ZARDIN, A.M.S.O., OLIVEIRA, C.A.L., OLIVEIRA, S.N., YOSHIDA, G.M., ALBUQUERQUE, D.T., CAMPOS, C.M. and RIBEIRO, R.P., 2019. Growth curves by Gompertz nonlinear regression model for male and female Nile tilapias from different genetic groups. Aquaculture (Amsterdam, Netherlands), vol. 511, pp. 734243. http://dx.doi.org/10.1016/j.aquaculture.2019.734243.
http://dx.doi.org/10.1016/j.aquaculture....
. In this regard, different studies investigating the growth curve should be interpreted carefully, because, depending on the management, density and genetics, different growth curves may be obtained.
5. Conclusion
The families of Nile tilapia AquaAmérica variety showed (i) different performance at 133 and 181 days of experiment; (ii) superior performance in two of the 20 evaluated families; (iii) superiority of males in relation to females, with the greatest contrast between the sexes occurring at 181 days of experiment; and (iv) distinct growth curves between the families, especially for asymptotic weight.
Acknowledgements
This study was financed in part by the Coordenação de Aperfeiçoamento de Pessoal de Nível Superior - Brasil (CAPES) - Finance Code 001; and the Federal University of Mato Grosso do Sul (UFMS) - Brazil.
References
- AMANCIO, A.L.L., SILVA, J.H.V., FERNANDES, J.B.K., SAKOMURA, N.K. and CRUZ, G., 2014. Use of mathematical models in the study of bodily growth in GIFT strain Nile tilapia. Ciência Agronômica, vol. 45, no. 2, pp. 257-266. http://dx.doi.org/10.1590/S1806-66902014000200005
» http://dx.doi.org/10.1590/S1806-66902014000200005 - EKNATH, A.E., BENTSEN, H.B., PONZONI, R.W., RYE, M., NGUYEN, N.H., THODESEN, J. and GJERDE, B., 2007. Genetic improvement of farmed tilapias: composition and genetic parameters of a synthetic base population of Oreochromis niloticus for selective breeding. Aquaculture (Amsterdam, Netherlands), vol. 273, no. 1, pp. 1-14. http://dx.doi.org/10.1016/j.aquaculture.2007.09.015
» http://dx.doi.org/10.1016/j.aquaculture.2007.09.015 - EL-SAYED, E.M., 2006. Tilapia culture Cambridge: CABI publishing, 277 p. http://dx.doi.org/10.1079/9780851990149.0000
» http://dx.doi.org/10.1079/9780851990149.0000 - FIALHO, F.B., 1999. Interpretação da curva de crescimento de Gompertz Concórdia: Embrapa - CNPSA, 4 p.
- FOOD AND AGRICULTURE ORGANIZATION – FAO, 2020 [viewed 10 September 2020]. FishStatJ - Software for Fishery and Aquaculture Statistical Time Series [online]. Available from: http://www.fao.org/fishery/statistics/software/fishstatj/en
» http://www.fao.org/fishery/statistics/software/fishstatj/en - GARCIA, A.L.S., DE OLIVEIRA, C.A.L., KARIM, H.M., SARY, C., TODESCO, H. and RIBEIRO, R.P., 2017. Genetic parameters for growth performance, fillet traits, and fat percentage of male Nile tilapia (Oreochromis niloticus). Journal of Applied Genetics, vol. 58, no. 4, pp. 527-533. http://dx.doi.org/10.1007/s13353-017-0413-6 PMid:28988364.
» http://dx.doi.org/10.1007/s13353-017-0413-6 - HAMZAH, A., PONZONI, R.W., NGUYEN, N.H., KHAW, H.L., YEE, H.Y. and NOR, S.A.M., 2014 [viewed 10 September 2020]. Genetic evaluation of the Genetically Improved Farmed Tilapia (GIFT) strain over ten generations of selection in Malaysia. Journal Tropical Agricultural Science [online]. vol. 37, no. 4, pp. 411-429. Available from: https://hdl.handle.net/20.500.12348/65
» https://hdl.handle.net/20.500.12348/65 - MARCOS, R., CORRÊA-FILHO, R.A.C., ABREU, J.S., SERAPHIM, G.N., SILVA, A.C.C., FORNARI, D.C., RIBEIRO, R.P., PIRES, L.B., MARTINS, T.X. and POVH, J.A., 2020. Growth curve of selectively Bred Tambaqui (Colossoma macropomum) reared in different environments. Journal of Agricultural Studies, vol. 8, no. 3, pp. 586-600. http://dx.doi.org/10.5296/jas.v8i3.16379
» http://dx.doi.org/10.5296/jas.v8i3.16379 - MARENGONI, N.G., MACHADO, L.M.C., OLIVEIRA, C.A.L., YOSHIDA, G.M., KUNITA, N.M. and RIBEIRO, R.P., 2015. Características morfológicas e desempenho de crescimento de monossexo macho de tilápia da variedade GIFT e Saint Peter®. Semina: Ciências Agrárias, vol. 36, no. 5, pp. 3399. http://dx.doi.org/10.5433/1679-0359.2015v36n5p399
» http://dx.doi.org/10.5433/1679-0359.2015v36n5p399 - NGUYEN, H.N., 2016. Genetic improvement for important farmed aquaculture species with a reference to carp, tilapia and prawns in Asia: achievements, lessons and challenges. Fish and Fisheries, vol. 17, no. 2, pp. 483-506. http://dx.doi.org/10.1111/faf.12122
» http://dx.doi.org/10.1111/faf.12122 - OLIVEIRA, A.M.S., OLIVEIRA, C.A.L., MATSUBARA, B.J.A., OLIVEIRA, S.N., KUNITA, N.M., YOSHIDA, G.M. and RIBEIRO, R.P., 2013. Growth patterns of male and female of Nile tilapia (Oreochromis niloticus) GIFT variety. Semina: Ciências Agrárias, vol. 34, pp. 1891-1900. http://dx.doi.org/10.5433/1679-0359.2013v34n4p1891
» http://dx.doi.org/10.5433/1679-0359.2013v34n4p1891 - OLIVEIRA, C.A.L., RIBEIRO, R.P., YOSHIDA, G.M., KUNITA, N.M., RIZZATO, G.S., OLIVEIRA, S.N., SANTOS, A.I. and NGUYEN, H.N., 2016. Correlated changes in body shape after five generations of selection to improve growth rate in a breeding program for Nile tilapia Oreochromis niloticus in Brazil. Journal of Applied Genetics, vol. 57, no. 4, pp. 487-493. http://dx.doi.org/10.1007/s13353-016-0338-5 PMid:26810351.
» http://dx.doi.org/10.1007/s13353-016-0338-5 - OLIVEIRA, S.N., RIBEIRO, R.P., OLIVEIRA, C.A.L., ALEXANDRE, L., OLIVEIRA, A.M.S., LOPERA-BARRERO, N.M., SANTANDER, V.F.A. and SANTANA, R.A.C., 2017. Interactive effects of genotype x environment on the live weight of GIFT Nile tilapias. Anais da Academia Brasileira de Ciências, vol. 89, no. 4, pp. 2931-2943. http://dx.doi.org/10.1590/0001-3765201720150629 PMid:29236869.
» http://dx.doi.org/10.1590/0001-3765201720150629 - PEIXE BR, 2020. Anuário 2020 Peixe BR da Piscicultura São Paulo: Peixe Br.
- REGAZZI, A.J. and SILVA, C., 2004. Teste para verificar a igualdade de parâmetros e a identidade de modelos de regressão não-linear. I. Dados no delineamento inteiramente casualizado. Revista de Matemática e Estatística, vol. 22, no. 3, pp. 33-45.
- REIS-NETO, R.V., OLIVEIRA, C.A.L., RIBEIRO, R.P., FREITAS, R.T.F., ALLAMAN, I.B. and OLIVEIRA, S.N., 2017. Genetic differences between sexes for morphometric traits of GIFT tilapia. Aquaculture Research, vol. 48, no. 3, pp. 1-9. http://dx.doi.org/10.1111/are.12966
» http://dx.doi.org/10.1111/are.12966 - RIBEIRO, R.P., 2001. Construção de tanques. In: S. ZIMMERMANN, H.L.M. MOREIRA, L. VARGAS and R.P. RIBEIRO, eds. Fundamentos da moderna aquicultura Canoas: ULBRA, pp. 45-52.
- SERAPHIM, G.N., CORRÊA-FILHO, R.A.C., NUNES, A.L., PIRES, L.B., SILVA, T.G., FERREIRA, Y.A., ALMEIDA, L.C., MARTINS, T.X., LOPERA-BARRERO, N.M., SPICA, L.N. and POVH, J.A., 2020. Growth curve of pacu and the patinga hybrid farmed in a semi-intensive system. Semina: Ciências Agrárias, vol. 41, pp. 2285-2296. http://dx.doi.org/10.5433/1679-0359.2020v41n5supl1p2285
» http://dx.doi.org/10.5433/1679-0359.2020v41n5supl1p2285 - SILVA, F.V., SARMENTO, N.L.A.F., VIEIRA, J.S., TESSITORE, A.J.A., OLIVEIRA, L.L.S. and SARAIVA, E.P., 2009. Características morfométricas, rendimentos de carcaça, filé, vísceras e resíduos em tilápias-do-nilo em diferentes faixas de peso. Revista Brasileira de Zootecnia, vol. 38, no. 8, pp. 1407-1412. http://dx.doi.org/10.1590/S1516-35982009000800003
» http://dx.doi.org/10.1590/S1516-35982009000800003 - ZARDIN, A.M.S.O., OLIVEIRA, C.A.L., OLIVEIRA, S.N., YOSHIDA, G.M., ALBUQUERQUE, D.T., CAMPOS, C.M. and RIBEIRO, R.P., 2019. Growth curves by Gompertz nonlinear regression model for male and female Nile tilapias from different genetic groups. Aquaculture (Amsterdam, Netherlands), vol. 511, pp. 734243. http://dx.doi.org/10.1016/j.aquaculture.2019.734243
» http://dx.doi.org/10.1016/j.aquaculture.2019.734243 - ZIMMERMANN, S. and FITZSIMMONS, K., 2004. Tilapicultura intensiva. In: J.E.P. CYRINO, E.C. URBINATI, D.M. FRACALOSSI and N. CASTAGNOLLI, eds. Tópicos especiais em piscicultura de água doce tropical intensiva São Paulo: Sociedade Brasileira de Aqüicultura e Biologia Aquática/TecArt, pp. 239-266.
Publication Dates
-
Publication in this collection
11 June 2021 -
Date of issue
2022
History
-
Received
13 Sept 2020 -
Accepted
25 Nov 2020