The Mourão River basin is located on the central western region of the Paraná State – Brazil, between coordinates 23º 44’ - 24º 25 South latitude and 52º 12’ - 52º 30’ West longitude, between 270 and 820 m above sea level, and 1,648.21 km2 drainage area. Water quality was evaluated by monitoring physical, chemical and microbiological parameters. Monthly samplings were performed for a year at five sites in the basin for analysis of: pH, temperature, dissolved oxygen, biochemical oxygen demand, total nitrogen, ammoniacal nitrogen, nitrite, nitrate, total phosphorus, turbidity, total solids, volatile solids and fecal coliforms. The results of the evaluated parameters showed higher values than the limits set by CONAMA Resolution 357 from 2005 for Class 2 in some samples. The Water Quality Index (WQI) indicated that 72% of samples had average quality and 28% had good quality for the Mourão River basin. Higher values of WQI were observed after rainfall period with median of 75 compared to the dry period with median of 62. The source of the Mourão River is contaminated with fecal coliforms, evidencing the real need to treat sewage in rural areas.
Mourão river; watershed; water quality index
Resumo
A Bacia Hidrográfica do Rio Mourão, localizada na porção centro ocidental do Estado do Paraná – Brasil, entre as coordenadas 23º 44’ - 24º 25’ Latitude Sul e 52º 12’ - 52º 30’ Longitude Oeste, entre 270 e 820 m acima do nível mar, possui área de drenagem de 1.648,21 km2. Nesta bacia foi avaliada a qualidade da água por meio de monitoramento de parâmetros físico-químicos e microbiológicos. Foram realizadas coletas mensais durante um ano em 5 pontos selecionados da bacia, sendo realizadas análises de: potencial Hidrogeniônico, temperatura, oxigênio dissolvido, demanda bioquímica de oxigênio, nitrogênio total, nitrogênio amoniacal, nitrito, nitrato, fósforo total, turbidez, sólidos totais, sólidos voláteis e coliformes fecais. Os resultados dos parâmetros avaliados indicaram valores superiores aos limites preconizados na Resolução CONAMA 357 de 2005 para rios de classe 2 em algumas amostras. Com a análise do Índice de Qualidade das Águas (IQA), obteve-se 72% das amostras com qualidade média e 28% com qualidade boa para a bacia do Rio Mourão. Os maiores valores do IQA foram observados na época de chuvas com mediana de 75 comparados ao período de seca com mediana de 62. Constatou-se que a nascente do rio Mourão está contaminada com coliformes fecais, mostrando a real necessidade de se tratar os esgotos sanitários no meio rural.
Rio Mourão; bacia hidrográfica; índice de qualidade das águas
1 Introduction
Hydrological studies in watersheds are important to demonstrate the anthropogenic influences on environmental characteristics of water resources. The characterization of water resources in qualitative and quantitative aspects can be determined through studies leading to the recognition of relevant impacts on ways of use and occupation of land.
According to studies of the Brazilian National Water Agency (ANA), over 80% of the rivers in Brazil are in a good condition, but almost half of them, concentrated in urban areas, have poor or very poor quality. In this scenario, the Paraná River basin, which covers almost all the rivers of the Paraná State, has the worst indicators of pollution (ANA, 2012AGÊNCIA NACIONAL DE ÁGUAS – ANA, 2012. Bacia do Paraná é a mais poluída do país. Brasília.).
The Mourão River basin is located in the central-west region of the Paraná State, has 1648.21 km2 of area, covering urban and rural areas and with greater representativeness on the municipalities of Mamborê, Luiziana and Campo Mourão. The Mourão River has two small hydroelectric power plants with a capacity exceeding 20 MW, and flows into the Ivaí River, which in turn flows into the Paraná River basin.
The use of the WQI as a tool for classifying surface water resources considers converting a set of limnological data (water quality parameters) into a numerical value. This index has been widely used to know the quality of waters (Cude, 2001Cude, C., 2001. Oregon water quality index: a tool for evaluating water quality management effectiveness. Journal of the American Water Resources Association, vol. 37, no. 1, pp. 125-137. http://dx.doi.org/10.1111/j.1752-1688.2001.tb05480.x.
http://dx.doi.org/10.1111/j.1752-1688.20...
).
In this context, the present study sought to present a diagnosis of water quality on the basis of current legislation and on the determination of the Water Quality Index (WQI) for the Mourão River basin.
2 Material and Methods
The Mourão River basin is located in the central-west region of the Paraná State, between the coordinates 23º 44’ - 24º 25’ South Latitude and 52º 12’ - 52º 30’ West Longitude, between 270 and 820 m above sea level, and 1648.21 km2 of area. Most of the basin is fertile area with great ability to sustain intense agricultural activity, covering the municipalities of Engenheiro Beltrão, Quinta do Sol, Peabiru, Mamborê, Luiziana and Campo Mourão, totaling 149,090 inhabitants (IBGE, 2010).INSTITUTO BRASILEIRO DE GEOGRAFIA E ESTATÍSTICA – IBGE, 2010 [viewed 12 February 2012]. Censo demográfico [online]. Brasília. Available from: http://www.ibge.gov.br/cidadesat/topwindow.htm?1.
http://www.ibge.gov.br/cidadesat/topwind...
In the main stream bed of the Mourão River there are two small hydroelectric power plants with a capacity exceeding 20 MW, forming a lake of approximately 10.74 km2. According to Leli et al. (2010)Leli, I.T., Stevaux, J.C. and Nóbrega, M.T., 2010. Dinâmica espacial da hidrologia da bacia do rio Ivaí. Boletim de Geografia, vol. 28, no. 2, pp. 41-47., the river contributes with an average flow of 32.6 m3/s to the Ivaí River basin.
The sources are mainly located to the south and southwest of the basin, in the municipalities of Luiziana and Mamborê, respectively (Mezzomo, 2013Mezzomo, M.M., 2013. Caracterização geológica do trecho superior da bacia hidrográfica do Rio Mourão-PR: subsídio ao planejamento da paisagem. Revista Geoingá, vol. 5, no. 1, pp. 18-38.). Towards the mouth (north-east) from the lower section, the basin crosses the municipalities of Campo Mourão and Peabiru, and is a natural limit between the municipalities of Engenheiro Beltrão and Quinta do Sol, flowing into the Ivaí River, which in turn flows into the Paraná River (Figure 1).

The climate of the region is Cfa: mesothermal humid subtropical, with hot summer and infrequent frosts, rainfall concentrated in summer months, without well-defined dry season (Köppen, 1948KÖPPEN, W., 1948. Climatología: con un estudio de los climas de la Tierra. México: Fondo de Cultura Económica. 478 p.).
The average annual rainfall varies between 1,600 mm and 1,800 mm, with rainfall concentrated in the summer months, totaling 500 mm to 600 mm. (Maack, 2002Maack, R., 2002. Geografia física do Estado do Paraná. 3rd ed. Curitiba: Imprensa Oficial. 350 p. ). The driest months correspond to winter season with rainfall ranging from 250 mm to 350 mm (Caviglione et al., 2000Caviglione, J.H., Kiihl, L.R.B., Caramori, P.H. and Oliveira, D., 2000. Cartas climáticas do Paraná. Londrina: IAPAR.).
On the basis of mapping and field researches, 5 sites were selected for water quality assessment in the Mourão River basin, distributed near municipalities and districts in urban and rural areas (Table 1).
Location, characteristics and altitude of the collection sites in the Mourão River basin, Paraná State, Brazil.
Samples were collected in the morning, approximately 10 cm below the water surface, stored in ice and taken to the laboratory, according to procedures described in the ABNT (1987)ASSOCIAÇÃO BRASILEIRA DE NORMAS TÉCNICAS – ABNT, 1987. NBR 9898: preservação e técnicas de amostragem de efluentes líquidos e corpos receptores. Rio de Janeiro.. Monthly samplings included the four seasons of the year: summer, fall, winter and spring, from November 2012 to November 2013 (12 collections).
The following parameters were determined: pH (4500-H+), water temperature (2550), dissolved oxygen (DO, 4500-O), biochemical oxygen demand (BOD5,20, 5210), total nitrogen (TN, 4500-N), ammoniacal nitrogen (4500-NH3), nitrite (4500-NO2–), nitrate (4500-NO3–), total phosphorus (4500-P), turbidity (T, 2310), total solids (TS, 2540B), volatile solids (VS) and fecal coliforms (FC, 9221) according to methodologies described in Standard Methods for the Examination of Water and Wastewater (Eaton et al., 2005Eaton, A.D., Clesceri, L.S., Rice, E.W. and Greenberg, A.E., 2005. Standard methods for the examination of water and wastewater. 21th ed. Washington: American Public Health Association, American Water Works Association, Water Pollution Control Federation.), in triplicate. Parameters of pH, DO and temperature were measured at the time of collections in the water body with the aid of a multiparameter probe Hanna 9829.
Taking into account that the rivers of Mourão River basin are classified as Class 2, according to the Ordinance 19 of SUREHMA of 1992, the results of the water quality parameters monitored in the sites P1, P2, P3, P4 and P5 were compared to limits set forth in Conama Resolution 357/2005 (Brasil, 2005BRASIL. Ministério do Meio Ambiente, 2005. Resolução nº 357, de 17 de março de 2005. Dispõe sobre a classificação dos corpos de água e diretrizes ambientais para o seu enquadramento, bem como estabelece as condições e padrões de lançamento de efluentes, e dá outras providências. Diário Oficial da República Federativa do Brasil, Brasília, 18 mar. Seção 1, pp. 58-63.) for such rating.
The Water Quality Index (WQI) was calculated and expressed as a value, which classifies water samples with scores from zero (0) to one hundred (100), considering the water quality of the river: excellent (91-100); good (71-90); average (51-70); poor (26-50) and very poor (0-25). The Water Institute of Paraná State, regulating environmental agency, has applied this index for monitoring water quality of basins.
Data of monitoring in this study were presented in box plots, which allow observing the central tendency and variability of the sample data. To these plots, the median (50% percentile), the lower (25% percentile) and upper (75% percentile) quartiles and the measure of data dispersion were included, with the minimum and maximum values.
Descriptive statistics described the results, comparing the measures of central tendency and dispersion, using statistical inference and significance level of 5%.
Statistical inference was employed to describe the results, with the support of parametric ANOVA. Tukey’s post-hoc test was employed to compare the means and the Statistical Process Control (SPC), through control charts for variables, which are very useful when there are quality characteristics measured in numerical scale. These graphs were constructed from data obtained with descriptive statistics of the parameters analyzed.
3 Results and Discussions
Figure 2 shows the water temperature variation in the sampling sites during the study period, minimum and maximum values, median, and lower and upper quartiles of samples.

The average monthly rainfall in the municipality of Campo Mourão, from 1976 to 2007, is shown in Figure 3.

Considering the Figure 3, the median of temperature in sites P1, P2 and P3 was similar to 23 °C, with variation range of 18 °C at the site P3 and 28 °C at the site P2 during the period of study. In the sites P4 and P5, median values were 21 °C with variation range of 18-26 °C. This difference may be related to several factors, including seasons of the year, climate of the region, rainy and dry periods, and difference of altitude from about 600 m (sites P4 and P5) to 300 m (sites P1, P2 and P3).
The months of January, February and December were classified as a rainy period, in which the average rainfall was 180 mm/month, and the months of June, July and August as dry period with average rainfall of 80 mm/month. These quarters were chosen because presented significant variability in relation to the climatological average of 137 mm.
Figure 4 illustrates the variation of turbidity and concentrations of total and volatile solids in the sampling sites, the minimum and maximum values, lower and upper quartiles and the median of the samples.

Variation of turbidity and concentrations of total and volatile solids in the sampling sites P1, P2, P3, P4 and P5.
The median turbidity varied from 25 to 36 NTU among sites, with a minimum of 5 NTU at P3 in the dry period and maximum of 124 NTU, higher than 100 NTU recommended by the law for Class 2.
At the sites P1, P4 and P5, values were higher than 100 NTU; and at P5, 25% of the samples exceeded the limit.
In relation to interquartile range, P4 had the smallest variation (25 NTU) and P5 showed the largest variation (64 NTU). It is important to highlight that the two micro basins are strictly rural, and show significant differences between them.
Samples showed variation in the concentration of total solids in samplings at the same site, as observed at P2 with interquartile difference of 77 mg/L compared to P3 with difference of 26 mg/L.
At the sites P1, P2 and P3, the median was 49 mg/L, below the median of P4 and P5 (56 mg/L). It was noted an increased amount of particles transported to the river in the rainy period, especially in sites P4 and P5, due to the lack of protection of embankments. At these sites, the soil remains exposed to inclement weather, leading to loss of soil to the water resource during the sowing.
Approximately 50% of the total solids refer to organic matter expressed as volatile solids at the sites P1, P2 and P3. This percentage increases to 62% in exclusively rural sites (P4 and P5).
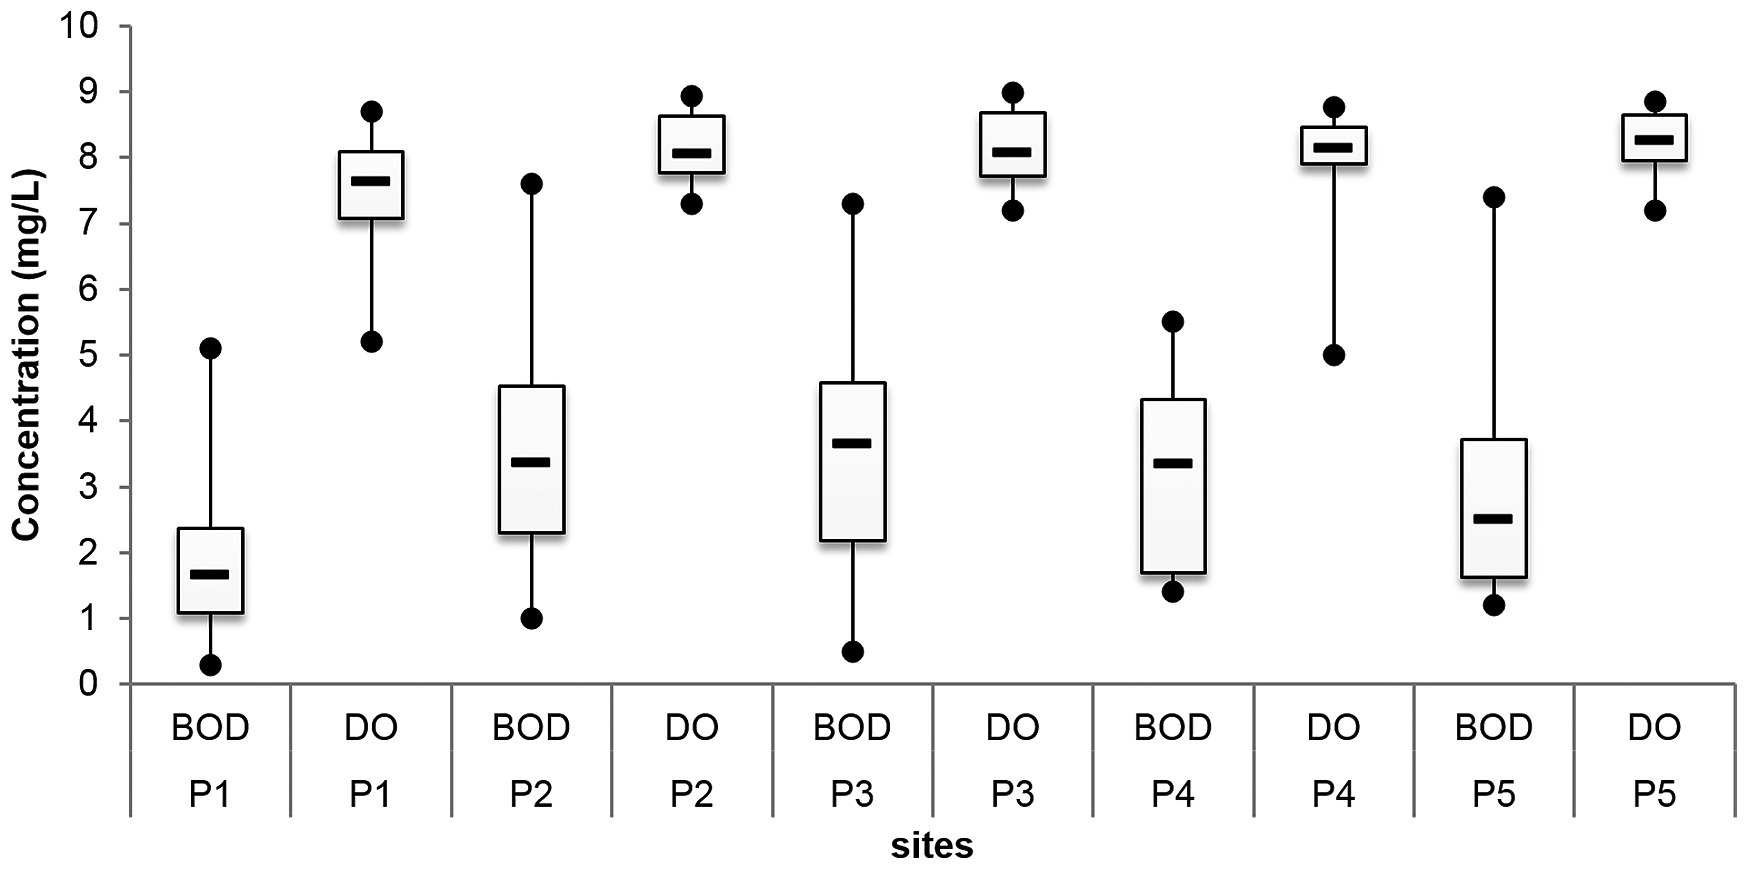
Figure 5 presents the variation in organic matter concentration in terms of BOD5,20 and dissolved oxygen concentration along the period of study in the sampling sites, the point of minimum and maximum, lower and upper quartiles and the median.

Variation of organic matter concentration in terms of BOD5,20 and dissolved oxygen concentration in the sampling sites P1, P2, P3, P4 and P5.
In 8% of the samples there were values above the recommended by the current legislation of 5 mgBOD5,20/L in all samplings sites. Better results considering the concentration of organic matter were found at P1 during the sampling period, with a median of 1.7 mg/L and 75% of samples with value lower than 2.4 mg/L.
The site P3 showed the worst result with median of 3.7 mg/L and maximum value of 7.6 mg/L of organic matter concentration, expressed in BOD5,20. It was observed that 25% of the samples had results above the limit set by the Resolution 357/2005 (Brasil, 2005BRASIL. Ministério do Meio Ambiente, 2005. Resolução nº 357, de 17 de março de 2005. Dispõe sobre a classificação dos corpos de água e diretrizes ambientais para o seu enquadramento, bem como estabelece as condições e padrões de lançamento de efluentes, e dá outras providências. Diário Oficial da República Federativa do Brasil, Brasília, 18 mar. Seção 1, pp. 58-63.) and 75% of the samples showed results below 4.6 mg/L.
In the sites P4 and P5, land use and occupation is exclusively rural, and water of these sites flow into the lake of the Mourão hydropower plant, and then get together in the site P4. The medians of these sites resulted in 3.4 and 2.5 mg/L, respectively, which demonstrate the lack of rural sanitation in the basin.
Data of organic matter expressed in DBO5,20 indicate that the water quality of the Mourão River deteriorated in the dry period.
In all sites, the concentrations of dissolved oxygen (DO) were equal to or higher than 5.0 mg/L, which is the limit recommended by the current legislation (Figure 5). The high concentration of DO may be explained by the rocky formation the bed rivers, which causes greater turbulence in waters and consequent increased transfer of oxygen at the air-water interface, and by the difference in altitude between the headwaters with 820 m altitude and the mouth with 270 m altitude.
Figure 6 presents the results of fecal coliform, with points of minimum and maximum, upper and lower quartiles and the median. The presence of fecal coliforms in waters indicates contamination by warm-blooded animals or sewage.

Fecal coliforms were registered in all samples analyzed, with median above 1,000 MPN/100 mL in all sites, and 90% of samples with values higher than the limit of 1,000 MPN/100 mL, recommended in the legislation for Class 2. The exception was observed at the site P4, whose median was 915 MPN/100 mL and with 50% of samples showing values above the established by the resolution.
The worst results were found in the site P3 with 75% of samples lower than 6,397 MPN/100 mL, above the recommended in the legislation. At this site, there is confluence with the two tributaries of the Mourão River, Km 119 and Campo rivers, which in turn receive contribution of sewage from the municipality of Campo Mourão. The sewage of Campo Mourão is treated to secondary level by biological processes, but without including the step of disinfection.
It is important to emphasize that high medians were registered in the sites P4 and P5, exclusively rural sites, with values of up to 9,864 MPN/100 mL, reflecting the contamination by domestic sewage or warm-blooded animals.
In the dry period, higher values of fecal coliforms were found at sites P1, P2, P3 and P5 with the higher value of 9,864 MPN/100 mL at site P5 during this period.
Results related to the pH at the 5 sampling sites during the period, the points of maximum and minimum, upper and lower quartiles and the median are presented in Figure 7.

Regarding the pH, all samples collected and analyzed were within the range 6.0-9.0 described in the legislation for Class 2, with median of 7.0 in all sampling sites.
The Mourão River basin was examined for different forms of nitrogen: total Kjeldahl nitrogen, ammoniacal nitrogen, nitrite and nitrate, as shown in Figure 8, with minimum and maximum, lower and upper quartiles and the median.

Variation in the concentration of nitrogen compounds (TKN, N-ammon, nitrite and nitrate) in the sampling sites P1, P2, P3, P4 and P5.
Nitrogen was monitored as nitrite, being observed median values from 0.2 to 0.4 mg/L in the sites of the Mourão River basin, lower than established by the current environmental legislation (1 mg/L). In relation to nitrate, the results were below 10 mg/L, the value set in the legislation, in all samples collected with median of 0.2 mg/L.
As for ammoniacal nitrogen, 10% of the samples of the sites P3, P4 and P5 showed values higher than the concentration established in the legislation. The site P3 exhibited the worst values, since it receives contributions from the urban area, even with secondary treatment of the sanitary sewage, and from the rural area, represented by the sites P4 and P5. The presence of ammoniacal nitrogen may be related to raw sewage, recent pollution and intermediate levels of pollution.
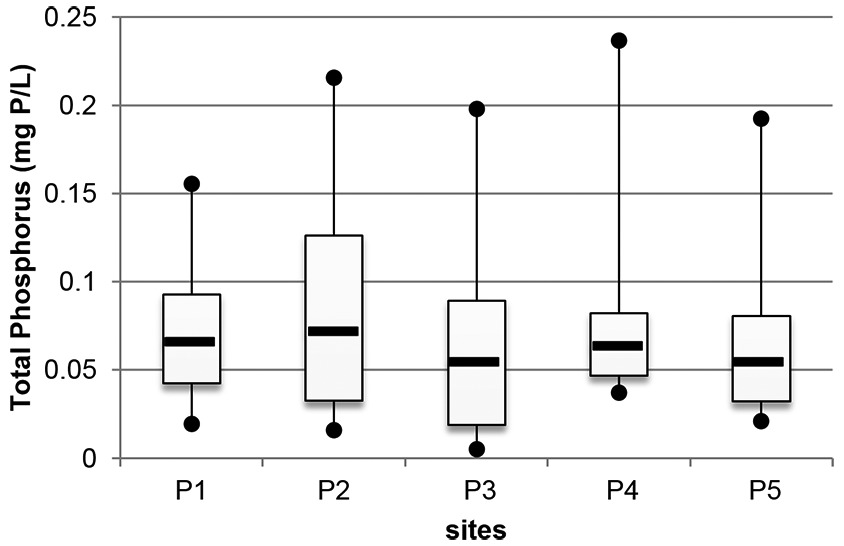
Phosphorus has an essential role in the eutrophication of water resources, and the origin of this nutrient from agricultural areas is considered important as water quality indicator, once other indicators as suspended solids and turbidity are associated with transport of phosphorus. Figure 9 presents the results of total phosphorus concentration in the 5 sampling sites, with point of minimum and maximum, upper and lower quartiles and the median.

Median values of the sites comply with the limit of 0.1 mg/L set by the legislation, but 23% of the samples presented higher values. The site with the highest phosphorus concentration was the site P2, where 33% of the samples demonstrated values above the limit.
In turn, the site P5 showed 25% of the samples with results above the limit, median of 0.05 and maximum of 0.19 mg/L. The site P4 had a median of 0.06, but only one sample presented a concentration above the limit. It is worth emphasizing that the sites P4 and P5 correspond to strictly rural area, but with different characteristics.
The median concentration of total phosphorus was lower in the rainy period, 0.11 mg/L, slightly lower than the value established by the current legislation.
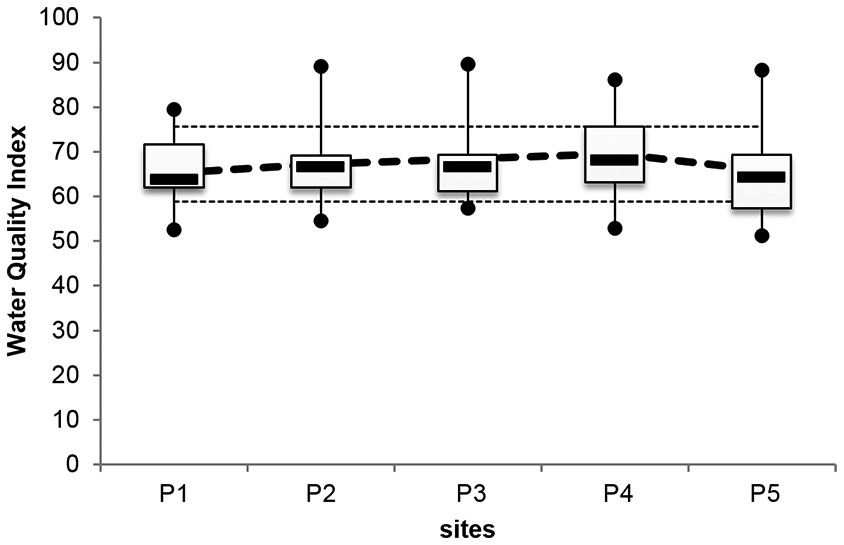
Water Quality Index results are shown in Figure 10, with point of minimum and maximum, upper and lower quartiles, and the median.

Variation of the Water Quality Index in the sampling sites. Statistical process control chart, represented by the 3 dotted lines, upper and lower control limits and the mean represented by the central dotted line.
According to Figure 10, 28% of the samples of the Mourão River basin have good quality, and 72% of the samples have average quality. This is also verified as a function of medians between 65 and 68. The greatest variability of results was observed in the sites P4 and P5, with interquartile range of 13 and 12, respectively. Also, the water quality in the basin suffered significant influence of rainfall, since the WQI value was 75 during the rainy period and reduced to 62 in the dry period.
In Figure 10, the 3 dotted lines of the statistical process control chart represent two control limits, the upper and the lower, which defines a confidence interval, with confidence level of 99.73%, and the middle line corresponds to the mean water quality index of the Mourão River basin. There were no significant differences for WQI results between the sites studied.
The highest WQI was verified at the site P4, without outliers, but large variance. Despite presenting two high value outliers, the site P5 had the lowest mean value. Values of this index were nearly homogeneous across the basin, and also showed normality in their distribution in the different sites analyzed; in other words, despite the outliers, the watershed exhibited a constant WQI in the examined area.
The median of WQI values is within the range 64-68. In this way, a parametric ANOVA was run to confirm this homogeneity, as listed in Table 2.
According to descriptive statistics, the parameters analyzed presented normal distribution (Table 2). The ANOVA for WQI results evidenced that the model is quite significant with F(0.05;4;60) = 2.53. The p-value indicated that the sites in the basin are not significantly different from each other, confirmed by the Tukey’s post-hoc test, that is, at a significance level of 5%, WQI values were statistically similar.
The parameters turbidity, temperature, pH, DO, BOD5,20, total solids, volatile solids, total nitrogen, ammoniacal nitrogen, nitrite, nitrate, total phosphorus and fecal coliforms used to determine the WQI for the Mourão River basin, were also evaluated and shown in Table 2.
The results of p-value of the different parameters investigated are considered statistically similar for samples collected in the basin. The dissolved oxygen showed a low p-value, but the Tukey’s post-hoc test confirmed the lack of significant difference between them, which is also observed in the other parameters.
As there were no differences in parameters used to determine the WQI, the result of ANOVA and Tukey’s test indicate no significant difference for the values of WQI between sites analyzed along the basin.
Figure 10 presents the statistical process control chart, in which it was verified that WQI values showed little variation between the five different sites of the basin. Moreover, the mean values remained within the limits: Upper limit of 75.11 and Lower limit of 59.47, with standard deviation of 9.42, with values very close to the average point, corroborating the little variation demonstrated by the parametric tests applied.
The results of the sites P1 and P5 were lower than the mean, which was also illustrated in Figure 1. Therefore, it can be concluded that the WQI of the Mourão River basin showed no significant variations during the sampling period.
4 Conclusion
In general, the water quality index of the Mourão River basin can be classified as average in 72% of samples and good in 28% of the samples.
The rainy period, represented by the months of January, February and December, improves the Water Quality Index, once the value of this index was 75, whereas in the dry period (June, July and August) this value was reduced to 62.
The water quality assessment on the basis of WQI and analysis of parameters separately demonstrates the need for changes related to management of water resources in the basin, since in some sites, certain parameters indicated situations that do not comply with the requirements of the current legislation.
Acknowledgements
The authors thank FINEP for the financial support to this research by means of the public notice (Edital CT-Hidro-MCT-FINEP 01-2010).
-
(With 12 Figures)
References
- AGÊNCIA NACIONAL DE ÁGUAS – ANA, 2012. Bacia do Paraná é a mais poluída do país. Brasília.
- ASSOCIAÇÃO BRASILEIRA DE NORMAS TÉCNICAS – ABNT, 1987. NBR 9898: preservação e técnicas de amostragem de efluentes líquidos e corpos receptores. Rio de Janeiro.
- BRASIL. Ministério do Meio Ambiente, 2005. Resolução nº 357, de 17 de março de 2005. Dispõe sobre a classificação dos corpos de água e diretrizes ambientais para o seu enquadramento, bem como estabelece as condições e padrões de lançamento de efluentes, e dá outras providências. Diário Oficial da República Federativa do Brasil, Brasília, 18 mar. Seção 1, pp. 58-63.
- Caviglione, J.H., Kiihl, L.R.B., Caramori, P.H. and Oliveira, D., 2000. Cartas climáticas do Paraná. Londrina: IAPAR.
- Cude, C., 2001. Oregon water quality index: a tool for evaluating water quality management effectiveness. Journal of the American Water Resources Association, vol. 37, no. 1, pp. 125-137. http://dx.doi.org/10.1111/j.1752-1688.2001.tb05480.x.
» http://dx.doi.org/10.1111/j.1752-1688.2001.tb05480.x - Eaton, A.D., Clesceri, L.S., Rice, E.W. and Greenberg, A.E., 2005. Standard methods for the examination of water and wastewater. 21th ed. Washington: American Public Health Association, American Water Works Association, Water Pollution Control Federation.
- INSTITUTO BRASILEIRO DE GEOGRAFIA E ESTATÍSTICA – IBGE, 2010 [viewed 12 February 2012]. Censo demográfico [online]. Brasília. Available from: http://www.ibge.gov.br/cidadesat/topwindow.htm?1.
» http://www.ibge.gov.br/cidadesat/topwindow.htm?1 - KÖPPEN, W., 1948. Climatología: con un estudio de los climas de la Tierra. México: Fondo de Cultura Económica. 478 p.
- Leli, I.T., Stevaux, J.C. and Nóbrega, M.T., 2010. Dinâmica espacial da hidrologia da bacia do rio Ivaí. Boletim de Geografia, vol. 28, no. 2, pp. 41-47.
- Maack, R., 2002. Geografia física do Estado do Paraná. 3rd ed. Curitiba: Imprensa Oficial. 350 p.
- Mezzomo, M.M., 2013. Caracterização geológica do trecho superior da bacia hidrográfica do Rio Mourão-PR: subsídio ao planejamento da paisagem. Revista Geoingá, vol. 5, no. 1, pp. 18-38.
Publication Dates
-
Publication in this collection
27 Nov 2015 -
Date of issue
Dec 2015
History
-
Received
17 Jan 2015 -
Accepted
20 May 2015