
Abstract
Green lacewings are insects with great potential to be use in the biological control of agricultural pests, but relatively few studies have attempted to understand the genetic structure of these agents, especially those of predatory insects. The purpose of this study was to characterize genetically populations of C. externa using sequences of subunit I of the cytochrome oxidase, a mitochondrial gene, and examine the population structure of this species in sampled areas in São Paulo state. The results indicate high genetic diversity but no genetic structure, detected by AMOVA analysis, and high levels of haplotype sharing in the network. These genetic patterns could be a consequence of environmental homogeneity provided by agroecosystem (citrus orchard), allowing gene flow among populations. Probably there is a unique population in the area sampled that could be used as a population (genetic) source for mass-reared and posterior release in these farms.
Keywords:
COI gene; green lacewings; mitochondrial DNA; population structure
Resumo
Crisopídeos são insetos com grande potencial para uso em controle biológico de pragas agrícolas, mas relativamente poucos estudos têm tentado compreender a estrutura genética destes agentes, especialmente no caso de insetos predadores. O objetivo deste trabalho foi caracterizar geneticamente populações de C. externa utilizando sequências da subunidade I do gene mitocondrial citocromo oxidase e avaliar a estruturação populacional desta espécie em áreas amostras no estado de São Paulo. Os resultados indicaram elevada diversidade genética e nenhuma estruturação genética, detectada pela AMOVA, além de elevado compartilhamento na rede haplotípica. Este padrão genético poderia ser uma consequência da homogeneidade ambiental favorecida pelos agroecossistemas (citricultura), permitindo fluxo gênico entre as populações. Provavelmente há uma única população, do ponto de vista genético, na área amostrada que poderia ser utilizada em criações massais e em liberações nas fazendas desta região.
Palavras-chave:
gene COI; crisopídeos; DNA mitocondrial; estrutura populacional
1 Introduction
The approaches involved in biological control programs are closely related with ecological concepts, especially about prey-predator population cycles (Hufbauer and Roderick, 2005Hufbauer, R.A. and Roderick, G.K., 2005. Microevolution in biological control: mechanisms, patterns, and processes. Biological Control, vol. 35, no. 3, pp. 227-239. http://dx.doi.org/10.1016/j.biocontrol.2005.04.004.
http://dx.doi.org/10.1016/j.biocontrol.2...
) and food-web ecology (Straub et al., 2008Straub, C.S., Finke, D.L. and Snyder, W.E., 2008. Are the conservation of natural enemy biodiversity and biological control compatible goals? Biological Control, vol. 45, no. 2, pp. 225-237. http://dx.doi.org/10.1016/j.biocontrol.2007.05.013.
http://dx.doi.org/10.1016/j.biocontrol.2...
). Some traits involved in these ecological processes could be modified by the admixture of different genetically structured populations, once insects should be locally adapted (Hufbauer and Roderick, 2005Hufbauer, R.A. and Roderick, G.K., 2005. Microevolution in biological control: mechanisms, patterns, and processes. Biological Control, vol. 35, no. 3, pp. 227-239. http://dx.doi.org/10.1016/j.biocontrol.2005.04.004.
http://dx.doi.org/10.1016/j.biocontrol.2...
), these admixture could affect their genetic diversity, which can have positive and negative results in the suppression of a prey (Straub et al., 2008Straub, C.S., Finke, D.L. and Snyder, W.E., 2008. Are the conservation of natural enemy biodiversity and biological control compatible goals? Biological Control, vol. 45, no. 2, pp. 225-237. http://dx.doi.org/10.1016/j.biocontrol.2007.05.013.
http://dx.doi.org/10.1016/j.biocontrol.2...
).
The genetic structure and diversity of a species population can be assessed by molecular markers (Schrey et al., 2005Schrey, N.M., Reeve, J.D. and Anderson, F.E., 2005. Mitochondrial DNA analysis of the bark beetle predator F. (Coleoptera: Cleridae) reveals regional genetic differentiation. Thanasimus dubiusMolecular Ecology, vol. 14, no. 11, pp. 3317-3324. http://dx.doi.org/10.1111/j.1365-294X.2005.02684.x. PMid:16156805.
http://dx.doi.org/10.1111/j.1365-294X.20...
; Smith, 2005Smith, P.T., 2005. Mitochondrial DNA variation among populations of the glassy-winged sharpshooter, Homalodisca coagulate.Journal of Insect Science, vol. 5, no. 1, pp. 41. http://dx.doi.org/10.1093/jis/5.1.41. PMid:17119623.
http://dx.doi.org/10.1093/jis/5.1.41...
; Ito et al., 2011Ito, K., Nishikawa, H., Shimada, T., Ogawa, K., Minamiya, Y., Tomoda, M., Nakahira, K., Kodama, R., Fukuda, T. and Arakawa, R., 2011. Analysis of genetic variation and phylogeny of the predatory bug, , in Japan using mitochondrial gene sequences. Pilophorus typicusJournal of Insect Science, vol. 11, no. 18, pp. 18. http://dx.doi.org/10.1673/031.011.0118. PMid:21526929.
http://dx.doi.org/10.1673/031.011.0118...
; Muirhead et al., 2012Muirhead, K.A., Murphy, N.P., Sallam, N., DonnelLan, S.C. and Austin, A.D., 2012. Phylogenetics and genetic diversity of the Cotesia flavipes complex of parasitoid wasps (Hymenoptera: Braconidae), biological control agents of lepidopteran stemborers. Molecular Phylogenetics and Evolution, vol. 63, no. 3, pp. 904-914. http://dx.doi.org/10.1016/j.ympev.2012.03.003. PMid:22450357.
http://dx.doi.org/10.1016/j.ympev.2012.0...
), allowing the evaluation of gene flow, migration rates, isolation among populations, and other microevolutionary processes related with genetic differentiation (for a review see Hufbauer and Roderick, 2005Hufbauer, R.A. and Roderick, G.K., 2005. Microevolution in biological control: mechanisms, patterns, and processes. Biological Control, vol. 35, no. 3, pp. 227-239. http://dx.doi.org/10.1016/j.biocontrol.2005.04.004.
http://dx.doi.org/10.1016/j.biocontrol.2...
). These points can elucidate approaches for biological control releases increasing the chances of success. Even releases of native insects should have criteria; they should be mass-reared from local collected populations, so they will have adaptive traits for the local environment, due to the genetic similarity with population source (Ito et al., 2011Ito, K., Nishikawa, H., Shimada, T., Ogawa, K., Minamiya, Y., Tomoda, M., Nakahira, K., Kodama, R., Fukuda, T. and Arakawa, R., 2011. Analysis of genetic variation and phylogeny of the predatory bug, , in Japan using mitochondrial gene sequences. Pilophorus typicusJournal of Insect Science, vol. 11, no. 18, pp. 18. http://dx.doi.org/10.1673/031.011.0118. PMid:21526929.
http://dx.doi.org/10.1673/031.011.0118...
).
Field experiments using volatile plant compounds and synthetic sex pheromone of aphids were effective in attracting native species of green lacewings. The purpose of these experiments was to attract high numbers of green lacewings to the area, thus increasing the biological control of pests (Koczor et al., 2010Koczor, S., Szentkirályi, F., Birkett, M.A., Pickett, J.A., Voigt, E. and Tóth, M., 2010. Attraction of complex and . Chrysoperla carneaChrysopa spp. Lacewings (Neuroptera: Chrysopidae) to aphid sex pheromone components and a synthetic blend of floral compounds in HungaryPest Management Science, vol. 66, no. 12, pp. 1374-1379. http://dx.doi.org/10.1002/ps.2030. PMid:20949547.
http://dx.doi.org/10.1002/ps.2030...
). This research had two interesting aspects: 1) Chrysopa pallens and Chrysopa formosa, whose adults are also predators, were attracted in high number in the traps containing the synthetic aphids sex pheromone and 2) adults of the carnea complex, which only the larvae are predators, were attracted in high number by volatiles plant compounds, once they feed on pollen and nectar (Koczor et al., 2010Koczor, S., Szentkirályi, F., Birkett, M.A., Pickett, J.A., Voigt, E. and Tóth, M., 2010. Attraction of complex and . Chrysoperla carneaChrysopa spp. Lacewings (Neuroptera: Chrysopidae) to aphid sex pheromone components and a synthetic blend of floral compounds in HungaryPest Management Science, vol. 66, no. 12, pp. 1374-1379. http://dx.doi.org/10.1002/ps.2030. PMid:20949547.
http://dx.doi.org/10.1002/ps.2030...
). This relationship between species and volatiles compounds plays a role in the search for prey/food, and can possibly be observed among populations of the same species that present genetic structure. The admixture of such populations could negatively affect their capability in the search for prey/food, and therefore, the biological control becomes less effective.
Chrysoperla externa (Hagen, 1861) (Neuroptera: Chrysopidae) is one of four species in the genus Chrysoperla that occur in Brazil (Freitas, 2003Freitas, S., 2003. . Chrysoperla Steinmann, 1964 (Neuroptera, Chrysopidae): descrição de uma nova espécie do BrasilRevista Brasileira de Entomologia, vol. 7, no. 3, pp. 385-387. http://dx.doi.org/10.1590/S0085-56262003000300004.
http://dx.doi.org/10.1590/S0085-56262003...
). These species have a wide geographical distribution, from the south of the United States to the south of South America (Adams and Penny, 1985Adams, P.A. and Penny, N.D., 1985. Neuroptera of the amazon basin - introduction and Chrysopini. Acta Amazonica, vol. 15, no. 3-4, pp. 413-479. http://dx.doi.org/10.1590/1809-43921985153479.
http://dx.doi.org/10.1590/1809-439219851...
), and can be found in different types of environments, including agroecosystems (Canard et al., 1984Canard, M., Séméria, Y. and New, T.R., 1984. Biology of chrysopidae. Netherlands: Dr W. Junk Publishers, 308 p.).
The larvae of C. externa are generalist predators, feeding on insects considered to be agricultural pests, aphids, scale insects (Monophlebidae, Pseudococcidae, Eriococcidae, Coccidae, Diaspididae), spittlebug (Cercopidae, Cicadellidae, Membracidae, Fulgoridae), whiteflies (Aleyrodidae), psyllids (Psyllidae), thrips (Thysanoptera), eggs and larvae of Lepidoptera, mites (Tetranychidae, Eriophyidae), beetles, Diptera and others insects of Neuroptera order (Freitas, 2002Freitas, S., 2002. O uso de crisopídeos no controle biológico de pragas. In: J.R.P. PARRA, P.S.M. BOTELHO, B.S. CORRÊA-FERREIRA and J.M.S. BENTO. Controle biológico no Brasil: parasitóides e predadores. São Paulo: Manole, pp. 209-224.). As a result, green lacewings have been studied to be used in biological control programs and research regarding population structure, using molecular markers, could help in determining which population to be released for pest control. Genetic studies with Thanasimus dubius (Coleoptera: Cleridae), with sequences of mitochondrial COI gene, showed two main groups structured in north and south along its geographical distribution, with high gene flow within groups. It is possible that prey pheromone to attract mates also attracts the predator, due to this adaptive trait of T. dubius, the exchange of these natural enemies between the north and south region should be avoided, happening only in the region where there is genetic similarity among individuals (Schrey et al., 2005Schrey, N.M., Reeve, J.D. and Anderson, F.E., 2005. Mitochondrial DNA analysis of the bark beetle predator F. (Coleoptera: Cleridae) reveals regional genetic differentiation. Thanasimus dubiusMolecular Ecology, vol. 14, no. 11, pp. 3317-3324. http://dx.doi.org/10.1111/j.1365-294X.2005.02684.x. PMid:16156805.
http://dx.doi.org/10.1111/j.1365-294X.20...
).
Some molecular studies have been carried out with C. externa populations, indicating high genetic diversity, but low genetic distances among populations due to widespread haplotype sharing, suggesting lack of genetic structure (Morales and Freitas, 2010Morales, A.C. and Freitas, S., 2010. Haplotype characterization of the COI mitochondrial gene in . Chrysoperla externa (Neuroptera: Chrysopidae) from different environments in Jaboticabal, state of São Paulo, southeastern BrazilBrazilian Journal of Biology = Revista Brasileira de Biologia, vol. 70, no. 4, pp. 1115-1121. http://dx.doi.org/10.1590/S1519-69842010000500030. PMid:21180923.
http://dx.doi.org/10.1590/S1519-69842010...
; Morales et al., 2013Morales, A.C., Lavagnini, T.C. and Freitas, S., 2013. Loss of genetic variability induced by agroecosystems: (Hagen) (Neuroptera: Chrysopidae) as a case study. Chrysoperla externaNeotropical Entomology, vol. 42, no. 1, pp. 32-38. http://dx.doi.org/10.1007/s13744-012-0085-1. PMid:23949710.
http://dx.doi.org/10.1007/s13744-012-008...
). Although, when green lacewings populations of natural areas and agroecosystems are compared, significant genetic structure has been observed among groups, but not within groups (Morales et al., 2013Morales, A.C., Lavagnini, T.C. and Freitas, S., 2013. Loss of genetic variability induced by agroecosystems: (Hagen) (Neuroptera: Chrysopidae) as a case study. Chrysoperla externaNeotropical Entomology, vol. 42, no. 1, pp. 32-38. http://dx.doi.org/10.1007/s13744-012-0085-1. PMid:23949710.
http://dx.doi.org/10.1007/s13744-012-008...
). However, few studies related to the population structure of predator insects have been conducted despite their ecological and economic importance (Schrey et al., 2005Schrey, N.M., Reeve, J.D. and Anderson, F.E., 2005. Mitochondrial DNA analysis of the bark beetle predator F. (Coleoptera: Cleridae) reveals regional genetic differentiation. Thanasimus dubiusMolecular Ecology, vol. 14, no. 11, pp. 3317-3324. http://dx.doi.org/10.1111/j.1365-294X.2005.02684.x. PMid:16156805.
http://dx.doi.org/10.1111/j.1365-294X.20...
).
C. externa populations naturally occur in citrus orchards (Souza and Carvalho, 2002Souza, B. and Carvalho, C.F., 2002. Population dynamics and seasonal occurrence of adults of (Hagen, 1861) (Neuroptera: Chrysopidae) in a citrus orchard in southern Brazil. Chrysoperla externaActa Zoologica Academiae Scientiarum Hungaricae, vol. 48, pp. 301-310.), allowing the use of this native species for biological control instead of an exotic species, that can cause environmental damage and extinction of non-target insects (Howarth, 1991Howarth, F.G., 1991. Environmental impacts of classical biological control. Annual Review of Entomology, vol. 36, no. 1, pp. 485-509. http://dx.doi.org/10.1146/annurev.en.36.010191.002413.
http://dx.doi.org/10.1146/annurev.en.36....
; Ito et al., 2011Ito, K., Nishikawa, H., Shimada, T., Ogawa, K., Minamiya, Y., Tomoda, M., Nakahira, K., Kodama, R., Fukuda, T. and Arakawa, R., 2011. Analysis of genetic variation and phylogeny of the predatory bug, , in Japan using mitochondrial gene sequences. Pilophorus typicusJournal of Insect Science, vol. 11, no. 18, pp. 18. http://dx.doi.org/10.1673/031.011.0118. PMid:21526929.
http://dx.doi.org/10.1673/031.011.0118...
). There are many practices involving this action, 1) habitat management to attract and maintain populations of C. externa in the area (Fiedler et al., 2008Fiedler, A.K., Landis, D.A. and Wratten, S.D., 2008. Maximizing ecosystem services from conservation biological control: the role of habitat management. Biological Control, vol. 45, no. 2, pp. 254-271. http://dx.doi.org/10.1016/j.biocontrol.2007.12.009.
http://dx.doi.org/10.1016/j.biocontrol.2...
), this one maybe requires more knowledge about ecology (such as plants which can provide nectar, pollen and/or shelter for these insects) than about genetic structure; 2) inoculative and inundative releases, in these cases the genetic studies on population structure are essential.
The orange and its sub-products have relative influence over the economy, Brazil produces 60% of the world’s orange juice (Brasil, 2012BRASIL. Ministério da Agricultura, Pecuária e Abastecimento, 2012 [viewed 10 September 2012]. Citrus [online]. Available from: http://www.agricultura.gov.br/vegetal/culturas/citrus.
http://www.agricultura.gov.br/vegetal/cu...
), and the main orange producer is São Paulo State, responsible for 73% of the national production (São Paulo, 2012SÃO PAULO. Coordenadoria de Assistência Técnica Integral, 2012 [viewed 10 September 2012]. Anexo I – informações gerais da agropecuária do Estado de São Paulo. CATI [online]. Available from: http://www.cati.sp.gov.br/microbacias2/manualoperacional.php
http://www.cati.sp.gov.br/microbacias2/m...
).
Considering few studies regarding genetic patterns of C. externa populations and economy relevance of citrus orchards, the purpose of this study is to evaluate the genetic diversity and population structure of C. externa naturally found in citrus orchards in São Paulo State. Genetic analysis can determine if genetic structure is present in these populations or if they represent a single population. This information can help in the planning of biological control programs in this type of environment (citrus orchard) and which population would be chosen in case of mass-reared insects.
2 Material and Methods
Specimens were collected from citrus orchards using entomological nets at twelve locations across São Paulo State, Brazil, resulting in 114 samples of green lacewings (Table 1, Figure 1).Only the thorax was used for DNA extraction, and the head, wings and abdomen of each specimen received a voucher identification number and were stored in ethanol in the entomological collection of the Laboratório de Biologia Molecular do Departamento de Fitossanidade, Campus Jaboticabal-SP, FCAV-UNESP, Brazil.
Samples of Chrysoperla externa populations, used for genetic analysis, collected in São Paulo State, Brazil.
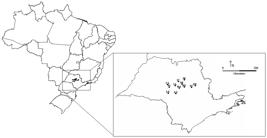
Brazilian map with Chrysoperla externa populations sampled in São Paulo State (detailed). The locality codes are the same of Table 1.
2.1 Total DNA extraction, polymerase chain reaction (PCR) and sequencing
DNA was extracted from a single individual preserved in ethanol using a Wizard™ Genomic DNA Purification Kit (Promega) supplemented with Proteinase K following the manufacturer’s protocols with a few minor changes. The homogenized individuals were incubated at 55°C for 3 hours. A fragment of the mitochondrial gene encoding the first subunit of cytochrome oxidase (COI) was amplified via PCR using the primers C1-J-2183 (5’ CAACATTTATTTTGATTTTTTGG 3’) and TL2–N-3014 (5’ TCCATTGCACTAATCTGCCATATTA 3’) (Simon et al., 1994Simon, C., Frati, F., Beckenbach, A., Crespi, B., Liu, H. and Flook, P., 1994. Evolution, weighting, and phylogenetic utility of mitochondrial gene sequences and a compilation of conserved Polymerase Chain Reaction primers. Annals of the Entomological Society of America, vol. 87, no. 6, pp. 651-701. http://dx.doi.org/10.1093/aesa/87.6.651.
http://dx.doi.org/10.1093/aesa/87.6.651...
). PCR was performed in volumes of 25 µL containing 2.0µL 10X buffer, 1.5mM MgCl2, 0.4µM dNTPs, 0.4µM of each primer and 1.5 units Taq polymerase (Promega). The thermal cycling conditions were: initial denaturation at 94°C (2 min), 35 cycles at 94°C (40 sec), 55°C (50 sec) and 72°C (1 sec), and a final annealing step at 72°C (10 min). The PCR products were checked for DNA amplification on 1% agarose gels. The reaction products were purified using a Wizard® SV Gel and PCR Clean-Up System (Promega) following the manufacturer’s protocols. Purified PCR products were sequenced with BigDye™ Terminator version 3.1 (Perkin-Elmer Applied Biosystems) using the same conditions and primers employed in the PCR. Subsequently, the fragments were washed several times with 75% isopropanol, followed by centrifugation. Sequences were read using an ABI Prism 3100 Genetic Analyzer.
2.2 Data analysis
The sequences were visualized with Chromas v.2.01 © (1998-2005) Technelysium Pty Ltd and were aligned using BioEdit v. 7.0.9.0 (Hall, 1999Hall, T.A., 1999. BioEdit: a user-friendly biological sequence alignment editor and analysis program for Windows 95/98/NT. Nucleic Acids Symposium Series, vol. 41, pp. 95-98.).
Measures of mitochondrial DNA (mtDNA) diversity, such as the number of haplotypes (h), haplotype diversity (Hd), nucleotide diversity (π), polymorphic sites (S) and average number of pairwise nucleotide differences (k), were calculated with DnaSP v.5 (Librado and Rozas, 2009Librado, P. and Rozas, J., 2009. DnaSP v5: a software for comprehensive analysis of DNA polymorphism data. Bioinformatics (Oxford, England), vol. 25, no. 11, pp. 1451-1452. http://dx.doi.org/10.1093/bioinformatics/btp187. PMid:19346325.
http://dx.doi.org/10.1093/bioinformatics...
). The genetic distances for all of the individuals and each population were estimated with MEGA v.4 (Tamura et al., 2007Tamura, K., Dudley, J., Nei, M. and Kumar, S., 2007. MEGA4: Molecular Evolutionary Genetics Analysis (MEGA) software version 4.0. Molecular Biology and Evolution, vol. 24, no. 8, pp. 1596-1599. http://dx.doi.org/10.1093/molbev/msm092. PMid:17488738.
http://dx.doi.org/10.1093/molbev/msm092...
). The haplotype network was inferred based on the statistical parsimony approach implemented in TCS v.1.21 (Clement et al., 2000Clement, M., Posada, D. and Crandall, K.A., 2000. TCS: a computer program to estimate gene genealogies. Molecular Ecology, vol. 9, no. 10, pp. 1657-1659. http://dx.doi.org/10.1046/j.1365-294x.2000.01020.x. PMid:11050560.
http://dx.doi.org/10.1046/j.1365-294x.20...
).
Inferences regarding changes in population size were made using Arlequin v. 3.5 (Excoffier and Lischer 2010Excoffier, L. and Lischer, H.E.L., 2010. Arlequin suite ver 3.5: a new series of programs to perform population genetics analyses under Linux and Windows. Molecular Ecology Resources, vol. 10, no. 3, pp. 564-567. http://dx.doi.org/10.1111/j.1755-0998.2010.02847.x. PMid:21565059.
http://dx.doi.org/10.1111/j.1755-0998.20...
). These included mismatch distribution analysis (Rogers and Harpending, 1992Rogers, A.R. and Harpending, H., 1992. Population growth makes waves in the distribution of pairwise genetic differences. Molecular Biology and Evolution, vol. 9, no. 3, pp. 552-569. PMid:1316531.) and two neutrality tests, Tajima’s D test (Tajima, 1989Tajima, F., 1989. Statistical method for testing the neutral mutation hypothesis by DNA polymorphism. Genetics, vol. 123, no. 3, pp. 585-595. PMid:2513255.) and Fu’s Fs test (Fu, 1997Fu, Y.X., 1997. Statistical tests of neutrality of mutations against population growth, hitchhiking and background selection. Genetics, vol. 147, no. 2, pp. 915-925. PMid:9335623.). All analyses proposed are appropriate for demographic inferences; however, neutrality tests provide more statistical support for detecting demographic events than mismatch distribution analysis (Ramos-Onsins and Rozas, 2002Ramos-Onsins, S.E. and Rozas, J., 2002. Statistical properties of new neutrality tests against population growth. Molecular Biology and Evolution, vol. 19, no. 12, pp. 2092-2100. http://dx.doi.org/10.1093/oxfordjournals.molbev.a004034. PMid:12446801.
http://dx.doi.org/10.1093/oxfordjournals...
).
Arlequin v. 3.5 (Excoffier and Lischer 2010Excoffier, L. and Lischer, H.E.L., 2010. Arlequin suite ver 3.5: a new series of programs to perform population genetics analyses under Linux and Windows. Molecular Ecology Resources, vol. 10, no. 3, pp. 564-567. http://dx.doi.org/10.1111/j.1755-0998.2010.02847.x. PMid:21565059.
http://dx.doi.org/10.1111/j.1755-0998.20...
) was used to conduct an Analysis of Molecular Variance (AMOVA) to assess population genetic structure, and the results were tested for statistical significance (p<0.05) with 16,000 permutations. This analysis estimates how intra- and interspecific variability is partitioned among several hierarchical levels: Φst – covariance within populations; Φsc – covariance among populations within groups; Φct – covariance among groups. The pairwise FST among populations was calculated with 16,000 permutations in Arlequin v. 3.5 (Excoffier and Lischer 2010Excoffier, L. and Lischer, H.E.L., 2010. Arlequin suite ver 3.5: a new series of programs to perform population genetics analyses under Linux and Windows. Molecular Ecology Resources, vol. 10, no. 3, pp. 564-567. http://dx.doi.org/10.1111/j.1755-0998.2010.02847.x. PMid:21565059.
http://dx.doi.org/10.1111/j.1755-0998.20...
), and results were considered significant when p<0.05. The effective number of migrants per generation (Nm) was obtained using FST values with the formula FST=1/2Nm+1.
3 Results
3.1 Molecular diversity indices and haplotype network analysis
A 649-bp fragment of the mitochondrial COI gene was used to analyze the 114 individuals (accession numbers HQ425564 - HQ425621; HQ668468 - HQ668523). The fragments analyzed had 35 polymorphic sites (S) and a nucleotide diversity (π) of 0.0035±0.002. Thirty-six haplotypes (h) were observed with a haplotype diversity (Hd) of 0.86, implying that the haplotypes were very different from each other. Despite this high haplotypic diversity, the average genetic distance among individuals was low, 0.004. Molecular diversity indices among each population are shown in Table 2.
Molecular diversity indices of mitochondrial COI gene for each Chrysoperla externa population.
The haplotype network (Figure 2) was star-like, and haplotypes were shared across different localities (Table 3). According to the parsimony criterion, two haplotypes were considered the most ancestral, 01 and 04, because they were more interior in the network and were the most frequent among the individuals sampled. Among them, haplotype 04 is more ancestral because its outgroup weight is the highest, 0.163, this parameter corresponds to the probability of this haplotype being the root or outgroup of network (Figure 2) (Castelloe and Templeton, 1994Castelloe, J. and Templeton, A.R., 1994. Root probabilities for intraspecific gene trees under neutral coalescent theory. Molecular Phylogenetics and Evolution, vol. 3, no. 2, pp. 102-113. http://dx.doi.org/10.1006/mpev.1994.1013. PMid:8075830.
http://dx.doi.org/10.1006/mpev.1994.1013...
).
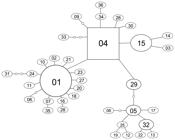
Haplotype network unrooted with sequences of mitochondrial COI gene obtained from Chrysoperla externa populations. Haplotypes are named as in Table 3. Each solid line represents one mutational change that interconnects two haplotypes that has a possibility greater than 95% level. Small circles without haplotype names denote missing intermediate haplotypes.
List of mitochondrial COI gene haplotypes shared in Chrysoperla externa populations in each geographical locality sampled.
3.2 Neutrality tests and demographic inferences
All tests performed allowed us to infer that the populations analyzed were subject to demographic events. The neutrality tests were significant; Tajima’s D was –1.99553 (p=0.003) and Fu’s Fs was –27.0672 (p=0.0). Both of these negative and significant values indicate population expansion (Tajima, 1989Tajima, F., 1989. Statistical method for testing the neutral mutation hypothesis by DNA polymorphism. Genetics, vol. 123, no. 3, pp. 585-595. PMid:2513255.; Fu, 1997Fu, Y.X., 1997. Statistical tests of neutrality of mutations against population growth, hitchhiking and background selection. Genetics, vol. 147, no. 2, pp. 915-925. PMid:9335623.). Although less powerful, the unimodal curve found with the mismatch distribution provided the same inference of neutrality tests, a population expansion (Figure 3). The star-like structure of the haplotype network also corroborated these results (Figure 2).
Graphics obtained with mismatch distribution analysis realized with sequences of mitochondrial COI gene of Chrysoperla externa.
3.3 Population genetic structure
Global AMOVA did not indicate genetic structure among populations (Φst=0.00114, p=0.44), and the analysis shows that 99.89% of the genetic variation is within populations, whereas only 0.11% is among populations. Due to this result, hierarchical AMOVA was not performed, but pairwise FSTs (Table 4) among the twelve populations sampled was calculated to detect the level of genetic proximity. The results of the pairwise FST test indicate that some populations are very closely related genetically (Table 4), so they were considered a single population unit due to the lower and non-significant results of this test.
Genetic distances (FST distances) and effective number of migrants (Nm), below and above diagonal, respectively, for twelve populations of Chrysoperla externa sampled in São Paulo State, Brazil.
The effective number of migrants per generation (Nm) was estimated for the twelve populations (Table 4), indicating intense gene flow, which agrees with the absence of genetic structure found in the Global AMOVA. One of the lowest values for Nm found was between Pirajuí and São Carlos populations, Nm=2.51, which coincide with the highest value for FST, 0.166 (Table 4).
4 Discussion
The potential use of C. externa in the biological control of agricultural pests requires a genetic study on natural enemies’ populations for planning their release with the purpose of admixture only populations with some genetic similarity. The observation of high genetic diversity and low genetic distance, evidenced by high haplotype sharing among populations, is an important issue regarding the population dynamics of C. externa, highlighting the intense gene flow, as shown in Table 4. The different farms with citrus orchards sampled in this study form a unique habitat, allowing the dispersion of populations as being considered a suitable habitat for their survival. This is corroborated by the results from the neutrality tests and mismatch distribution, suggesting demographic events of population expansion i.e., representing colonization events of these areas over time. Agreeing with this hypothesis, data set shows high haplotype diversity among populations (Table 2), in contrast with low nucleotide diversity, which suggest a rapid demographic expansion from a small effective population size (Avise, 2000Avise, J.C., 2000. Phylogeography: the history and formation of species. Cambridge: Harvard University Press, 447 p.).
The global AMOVA results showed no genetic structure, in agreement with the inference of high gene flow observed from the Nm parameter (Table 4). These populations most likely represent subpopulations of a major genetic unit across the geographic area in the countryside of São Paulo State in which citrus is cultivated. Such inference is congruent with the genetic analysis of C. externa populations sampled in native areas and agroecosystems, and the same pattern of genetic structure has been found in the latter (Morales et al., 2013Morales, A.C., Lavagnini, T.C. and Freitas, S., 2013. Loss of genetic variability induced by agroecosystems: (Hagen) (Neuroptera: Chrysopidae) as a case study. Chrysoperla externaNeotropical Entomology, vol. 42, no. 1, pp. 32-38. http://dx.doi.org/10.1007/s13744-012-0085-1. PMid:23949710.
http://dx.doi.org/10.1007/s13744-012-008...
).
Possible explanations for this genetic similarity is that citrus orchards favor the establishment and maintenance of genetic variability in C. externa populations, there is abundant food and large areas of citrus orchards forming corridors used by these insects in the countryside of São Paulo State. All tests conducted to detect demographic events support the hypothesis of corridor use, and the AMOVA test and Nm values (Table 4) infer high gene flow among the sampled populations. Even the Tietê River does not seem to act as a barrier to gene flow. In fact, some populations occur on different sides of the river, these values are too low and not significant to constitute genetic structure. On the other hand, this genetic similarity could be due to a shared polymorphism among populations that was present before population expansion or any differentiation that is too recent to be detected by these analyses. However, due to intense anthropic interference and extensive citrus orchard corridors, the hypothesis of high gene flow to explain the lack of genetic variation across large geographic distances is the most acceptable. The observed genetic similarity shows that C. externa constitutes a single population in the sampled area and that the insects found here can be used as a population (genetic) source for other citrus orchards with the same profile. Although there is no management of these populations (introgression of new individuals), the molecular diversity indices and haplotype network (Figure 2) indicate that high levels of genetic variability remain, and what is essential for successful biological control of agricultural pests.
The haplotype network is in agreement with the results of the other tests. The congruent results from the statistical analyses strengthen the inferences made regarding the population dynamics of C. externa.
Analyses with mitochondrial sequences have identified groups/clades within species, which agrees with geographical range or ecological traits. Genetic analysis with Pilophorus typicus (Hemiptera: Miridae) populations, a predatory bug as C. externa larvae, indicate that they are genetically structured forming two main clades (Ito et al., 2011Ito, K., Nishikawa, H., Shimada, T., Ogawa, K., Minamiya, Y., Tomoda, M., Nakahira, K., Kodama, R., Fukuda, T. and Arakawa, R., 2011. Analysis of genetic variation and phylogeny of the predatory bug, , in Japan using mitochondrial gene sequences. Pilophorus typicusJournal of Insect Science, vol. 11, no. 18, pp. 18. http://dx.doi.org/10.1673/031.011.0118. PMid:21526929.
http://dx.doi.org/10.1673/031.011.0118...
).This is probably due to ecological or behavioral features of these insects instead of geographical conditions, once Japan archipelago presents small territorial proportions in relation to São Paulo State, promoting genetic homogeneity among populations through gene flow. Another case of genetically structured populations was observed between north and south populations along geographical range of Thanasimus dubius (Coleoptera: Cleridae), also a predatory bug. The genetic divergence found should be due to differences in sex pheromone of its prey and not exclusively the geographic distances (Schrey et al., 2005Schrey, N.M., Reeve, J.D. and Anderson, F.E., 2005. Mitochondrial DNA analysis of the bark beetle predator F. (Coleoptera: Cleridae) reveals regional genetic differentiation. Thanasimus dubiusMolecular Ecology, vol. 14, no. 11, pp. 3317-3324. http://dx.doi.org/10.1111/j.1365-294X.2005.02684.x. PMid:16156805.
http://dx.doi.org/10.1111/j.1365-294X.20...
).
C. externa populations analyzed in this study did not show the same pattern. There are two possible reasons, not mutually exclusive: 1) the anthropic action is so strong that already erased genetic structure that existed before the agroecosystems and/or 2) recent colonization of this species in agroecosystems, so that one molecular marker, such as mitochondrial, is inappropriate to detect the recent history of this species in this environment. Probably, its evolutionary history is as recent as the history of agriculture in Brazil, so it should be used molecular markers with different modes of inheritance, as nuclear genes, for multi-locus analysis.
Considering these results, it is possible to conclude that the populations of C. externa sampled in the countryside of São Paulo State constitute a single population, with high dispersion and gene flow, most likely favored by the homogeneity of agroecosystems. For these farms, the mass-reared green lacewings for biological control releases could come from the same population source, which could be collected in any locality sampled in this work, due to the genetic identity among C. externa populations. Beyond biological control success, this practice avoids genetic introgression and extinction of non-target insects.
Acknowledgements
This study was supported by CNPq (Proc. n°131193/2009-0) for a Master of Science (MSc.) grant to the first author and FAPESP (Proc. n° 2006/03494-0) for financial support.
-
(With 3 figures)
References
- Adams, P.A. and Penny, N.D., 1985. Neuroptera of the amazon basin - introduction and Chrysopini. Acta Amazonica, vol. 15, no. 3-4, pp. 413-479. http://dx.doi.org/10.1590/1809-43921985153479.
» http://dx.doi.org/10.1590/1809-43921985153479 - Avise, J.C., 2000. Phylogeography: the history and formation of species. Cambridge: Harvard University Press, 447 p.
- BRASIL. Ministério da Agricultura, Pecuária e Abastecimento, 2012 [viewed 10 September 2012]. Citrus [online]. Available from: http://www.agricultura.gov.br/vegetal/culturas/citrus.
» http://www.agricultura.gov.br/vegetal/culturas/citrus - Canard, M., Séméria, Y. and New, T.R., 1984. Biology of chrysopidae. Netherlands: Dr W. Junk Publishers, 308 p.
- Castelloe, J. and Templeton, A.R., 1994. Root probabilities for intraspecific gene trees under neutral coalescent theory. Molecular Phylogenetics and Evolution, vol. 3, no. 2, pp. 102-113. http://dx.doi.org/10.1006/mpev.1994.1013. PMid:8075830.
» http://dx.doi.org/10.1006/mpev.1994.1013 - Clement, M., Posada, D. and Crandall, K.A., 2000. TCS: a computer program to estimate gene genealogies. Molecular Ecology, vol. 9, no. 10, pp. 1657-1659. http://dx.doi.org/10.1046/j.1365-294x.2000.01020.x. PMid:11050560.
» http://dx.doi.org/10.1046/j.1365-294x.2000.01020.x - Excoffier, L. and Lischer, H.E.L., 2010. Arlequin suite ver 3.5: a new series of programs to perform population genetics analyses under Linux and Windows. Molecular Ecology Resources, vol. 10, no. 3, pp. 564-567. http://dx.doi.org/10.1111/j.1755-0998.2010.02847.x. PMid:21565059.
» http://dx.doi.org/10.1111/j.1755-0998.2010.02847.x - Fiedler, A.K., Landis, D.A. and Wratten, S.D., 2008. Maximizing ecosystem services from conservation biological control: the role of habitat management. Biological Control, vol. 45, no. 2, pp. 254-271. http://dx.doi.org/10.1016/j.biocontrol.2007.12.009.
» http://dx.doi.org/10.1016/j.biocontrol.2007.12.009 - Freitas, S., 2002. O uso de crisopídeos no controle biológico de pragas. In: J.R.P. PARRA, P.S.M. BOTELHO, B.S. CORRÊA-FERREIRA and J.M.S. BENTO. Controle biológico no Brasil: parasitóides e predadores. São Paulo: Manole, pp. 209-224.
- Freitas, S., 2003. . Chrysoperla Steinmann, 1964 (Neuroptera, Chrysopidae): descrição de uma nova espécie do BrasilRevista Brasileira de Entomologia, vol. 7, no. 3, pp. 385-387. http://dx.doi.org/10.1590/S0085-56262003000300004.
» http://dx.doi.org/10.1590/S0085-56262003000300004 - Fu, Y.X., 1997. Statistical tests of neutrality of mutations against population growth, hitchhiking and background selection. Genetics, vol. 147, no. 2, pp. 915-925. PMid:9335623.
- Hall, T.A., 1999. BioEdit: a user-friendly biological sequence alignment editor and analysis program for Windows 95/98/NT. Nucleic Acids Symposium Series, vol. 41, pp. 95-98.
- Howarth, F.G., 1991. Environmental impacts of classical biological control. Annual Review of Entomology, vol. 36, no. 1, pp. 485-509. http://dx.doi.org/10.1146/annurev.en.36.010191.002413.
» http://dx.doi.org/10.1146/annurev.en.36.010191.002413 - Hufbauer, R.A. and Roderick, G.K., 2005. Microevolution in biological control: mechanisms, patterns, and processes. Biological Control, vol. 35, no. 3, pp. 227-239. http://dx.doi.org/10.1016/j.biocontrol.2005.04.004.
» http://dx.doi.org/10.1016/j.biocontrol.2005.04.004 - Ito, K., Nishikawa, H., Shimada, T., Ogawa, K., Minamiya, Y., Tomoda, M., Nakahira, K., Kodama, R., Fukuda, T. and Arakawa, R., 2011. Analysis of genetic variation and phylogeny of the predatory bug, , in Japan using mitochondrial gene sequences. Pilophorus typicusJournal of Insect Science, vol. 11, no. 18, pp. 18. http://dx.doi.org/10.1673/031.011.0118. PMid:21526929.
» http://dx.doi.org/10.1673/031.011.0118 - Koczor, S., Szentkirályi, F., Birkett, M.A., Pickett, J.A., Voigt, E. and Tóth, M., 2010. Attraction of complex and . Chrysoperla carneaChrysopa spp. Lacewings (Neuroptera: Chrysopidae) to aphid sex pheromone components and a synthetic blend of floral compounds in HungaryPest Management Science, vol. 66, no. 12, pp. 1374-1379. http://dx.doi.org/10.1002/ps.2030. PMid:20949547.
» http://dx.doi.org/10.1002/ps.2030 - Librado, P. and Rozas, J., 2009. DnaSP v5: a software for comprehensive analysis of DNA polymorphism data. Bioinformatics (Oxford, England), vol. 25, no. 11, pp. 1451-1452. http://dx.doi.org/10.1093/bioinformatics/btp187. PMid:19346325.
» http://dx.doi.org/10.1093/bioinformatics/btp187 - Morales, A.C. and Freitas, S., 2010. Haplotype characterization of the COI mitochondrial gene in . Chrysoperla externa (Neuroptera: Chrysopidae) from different environments in Jaboticabal, state of São Paulo, southeastern BrazilBrazilian Journal of Biology = Revista Brasileira de Biologia, vol. 70, no. 4, pp. 1115-1121. http://dx.doi.org/10.1590/S1519-69842010000500030. PMid:21180923.
» http://dx.doi.org/10.1590/S1519-69842010000500030 - Morales, A.C., Lavagnini, T.C. and Freitas, S., 2013. Loss of genetic variability induced by agroecosystems: (Hagen) (Neuroptera: Chrysopidae) as a case study. Chrysoperla externaNeotropical Entomology, vol. 42, no. 1, pp. 32-38. http://dx.doi.org/10.1007/s13744-012-0085-1. PMid:23949710.
» http://dx.doi.org/10.1007/s13744-012-0085-1 - Muirhead, K.A., Murphy, N.P., Sallam, N., DonnelLan, S.C. and Austin, A.D., 2012. Phylogenetics and genetic diversity of the Cotesia flavipes complex of parasitoid wasps (Hymenoptera: Braconidae), biological control agents of lepidopteran stemborers. Molecular Phylogenetics and Evolution, vol. 63, no. 3, pp. 904-914. http://dx.doi.org/10.1016/j.ympev.2012.03.003. PMid:22450357.
» http://dx.doi.org/10.1016/j.ympev.2012.03.003 - Ramos-Onsins, S.E. and Rozas, J., 2002. Statistical properties of new neutrality tests against population growth. Molecular Biology and Evolution, vol. 19, no. 12, pp. 2092-2100. http://dx.doi.org/10.1093/oxfordjournals.molbev.a004034. PMid:12446801.
» http://dx.doi.org/10.1093/oxfordjournals.molbev.a004034 - Rogers, A.R. and Harpending, H., 1992. Population growth makes waves in the distribution of pairwise genetic differences. Molecular Biology and Evolution, vol. 9, no. 3, pp. 552-569. PMid:1316531.
- SÃO PAULO. Coordenadoria de Assistência Técnica Integral, 2012 [viewed 10 September 2012]. Anexo I – informações gerais da agropecuária do Estado de São Paulo. CATI [online]. Available from: http://www.cati.sp.gov.br/microbacias2/manualoperacional.php
» http://www.cati.sp.gov.br/microbacias2/manualoperacional.php - Schrey, N.M., Reeve, J.D. and Anderson, F.E., 2005. Mitochondrial DNA analysis of the bark beetle predator F. (Coleoptera: Cleridae) reveals regional genetic differentiation. Thanasimus dubiusMolecular Ecology, vol. 14, no. 11, pp. 3317-3324. http://dx.doi.org/10.1111/j.1365-294X.2005.02684.x. PMid:16156805.
» http://dx.doi.org/10.1111/j.1365-294X.2005.02684.x - Simon, C., Frati, F., Beckenbach, A., Crespi, B., Liu, H. and Flook, P., 1994. Evolution, weighting, and phylogenetic utility of mitochondrial gene sequences and a compilation of conserved Polymerase Chain Reaction primers. Annals of the Entomological Society of America, vol. 87, no. 6, pp. 651-701. http://dx.doi.org/10.1093/aesa/87.6.651.
» http://dx.doi.org/10.1093/aesa/87.6.651 - Smith, P.T., 2005. Mitochondrial DNA variation among populations of the glassy-winged sharpshooter, Homalodisca coagulate.Journal of Insect Science, vol. 5, no. 1, pp. 41. http://dx.doi.org/10.1093/jis/5.1.41. PMid:17119623.
» http://dx.doi.org/10.1093/jis/5.1.41 - Souza, B. and Carvalho, C.F., 2002. Population dynamics and seasonal occurrence of adults of (Hagen, 1861) (Neuroptera: Chrysopidae) in a citrus orchard in southern Brazil. Chrysoperla externaActa Zoologica Academiae Scientiarum Hungaricae, vol. 48, pp. 301-310.
- Straub, C.S., Finke, D.L. and Snyder, W.E., 2008. Are the conservation of natural enemy biodiversity and biological control compatible goals? Biological Control, vol. 45, no. 2, pp. 225-237. http://dx.doi.org/10.1016/j.biocontrol.2007.05.013.
» http://dx.doi.org/10.1016/j.biocontrol.2007.05.013 - Tajima, F., 1989. Statistical method for testing the neutral mutation hypothesis by DNA polymorphism. Genetics, vol. 123, no. 3, pp. 585-595. PMid:2513255.
- Tamura, K., Dudley, J., Nei, M. and Kumar, S., 2007. MEGA4: Molecular Evolutionary Genetics Analysis (MEGA) software version 4.0. Molecular Biology and Evolution, vol. 24, no. 8, pp. 1596-1599. http://dx.doi.org/10.1093/molbev/msm092. PMid:17488738.
» http://dx.doi.org/10.1093/molbev/msm092
Publication Dates
-
Publication in this collection
10 Nov 2015 -
Date of issue
Nov 2015
History
-
Received
19 Feb 2014 -
Accepted
04 June 2014


