ABSTRACT:
Temperature affects plant development therefore phyllochron has been used as a predictor for developmental events to define the time for agricultural managing practices. This study aims to evaluate changes in phyllochron and thermal sum required for flowering by oat genotypes developed at different decades at three temperature regimes; the effect of high temperature on phytomere development; and identify the development stage at the moment of meristem transition to reproductive stage. Three environments were obtained by sowing in the fall, in the spring, and under constant temperature (17oC), always at inductive photoperiod. Despite changes in nominal values small differences were found among genotypes’ phyllochron. Adding specific optimal and maximum temperatures into the growing degree days’ calculation demonstrated phyllochron stability among environments. Plant cycle length and thermal sum correlated with the number of developed phytomeres. UFRGS 078030-2 plants flowered earlier, had a small number of phytomeres, and greater tolerance to elevated temperatures than the other genotypes. More recent genotypes transit to reproductive stage at an earlier Haun stage than older ones.
Key words:
Avena sativa; meristem transition; phyllochron; thermal sum; phytomer
RESUMO:
A temperatura afeta o desenvolvimento das plantas, portanto o filocrono tem sido usado para prever eventos de desenvolvimento e estabelecer o momento adequado para práticas agrícolas. Esse estudo buscou avaliar mudanças em filocrono e soma térmica até o florescimento de genótipos de aveia desenvolvidos em diferentes décadas em três regimes térmicos; o efeito de altas temperaturas no desenvolvimento de fitômeros; e identificar o estágio de desenvolvimento em que ocorre a transição do meristema para a fase reprodutiva. Três ambientes foram estabelecidos pela semeadura no outono, na primavera e em temperatura constante (17oC), em fotoperíodo indutor. Apesar da alteração dos valores numéricos, houve pouca diferença entre os filocronos dos genótipos. A adição das temperaturas ótima e máxima específicas no cálculo de graus dias demonstrou a estabilidade de filocrono entre ambientes. O ciclo e a soma térmica correlacionaram-se com o número de fitômeros. UFRGS 078030-2 floresceu mais cedo, teve menos fitômeros e maior tolerância a altas temperaturas do que os demais genótipos. Os genótipos mais recentes transitam para a fase reprodutiva em estágios mais precoces da escala Haun, em comparação com os genótipos mais antigos.
Palavras-chave:
Avena sativa; transição meristemática; filocrono; soma térmica; fitômero
INTRODUCTION:
The developmental cycle of oat (Avena sativa L.) plants varies from less than 110 to more than 200 days due to the interaction between the environment and unique genotype requirements (LOSTUKOV et al., 2019LOSTUKOV, I. G. et al. Diversity of photoperiodic responses in oats. Vavilov J Genet Breed, v. 23, p. 723-729, 2019. Available from: <Available from: https://doi.org/10.18699/VJ19.546 >. Accessed: Nov. 7, 2020. doi:10.18699/VJ19.546.
https://doi.org/10.18699/VJ19.546...
). The main difference refers to the number of days from emergence to flowering (DEF). Oat breeders in Brazil aim at reducing plant cycle because the cereal is a secondary crop, its cycle must allow soybean sowing at the correct time. UFRGS’s Oat Breeding Program has linearly reduced DEF(-0.292 day.year-1) in 35 years (WALDOW, 2012WALDOW, D.A.G. Genetic progress of yield and related agronomic characters in oat. Federal University of Rio Grande do Sul, 2012. ). This period comprises important stages to guarantee reproductive success and define yield potential, its length can affect genotype adaptation to particular geographic regions. The end of this period is modulated by temperature (thermal sum and vernalization) and photoperiod.
For genotypes considered insensitive to photoperiod the amount of temperature required to initiate and develop each phytomere, and the number of phytomeres define the length of plant life cycle. The phytomere is considered the fundamental building block of grass canopies (McMASTER, 2005McMASTER, G.S. Phytomers, phyllochrons, phenology and temperate cereal development. J Agric Sci, v.143, p.137-150, 2005. Available from: <Available from: https://doi.org/10.1017/S00218596050050 83 >. Accessed: Jan. 15, 2018. doi:10.1017/S0021859605005083.
https://doi.org/10.1017/S00218596050050 ...
). Each phytomere is constituted of leaf, axillary bud, node and internode and shoots are formed by successive additions of phytomere units at the shoot apex. This process is interrupted by the meristem transition from the vegetative to the reproductive stage.
Leaf primordia initiation and meristem transition can only be determined by destructive methods in cereals. To circumvent this limitation, in the 60’s the term phyllochron was proposed for the rate of leaf appearance (McMASTER, 2005McMASTER, G.S. Phytomers, phyllochrons, phenology and temperate cereal development. J Agric Sci, v.143, p.137-150, 2005. Available from: <Available from: https://doi.org/10.1017/S00218596050050 83 >. Accessed: Jan. 15, 2018. doi:10.1017/S0021859605005083.
https://doi.org/10.1017/S00218596050050 ...
). Since then, it has been used as a predictor for plant developmental events, such as the begin of axillary bud differentiation, and it helps to define the best time for managing practices, as nitrogen application (ROSA et al., 2009ROSA, H.T. et al. Métodos de soma térmica e datas de semeadura na determinação de filocrono de cultivares de trigo. PAB, v.44, p.1374-82, 2009. Available from: <Available from: https://doi.org/10.1590/ S0 100-204X2009001100002 >. Accessed: May. 3, 2018. doi: 10.1590/S0100-204X2009001100002.
https://doi.org/10.1590/ S0 100-204X2009...
). The concept of phyllochron is based on the fact that the production rate of new phytomeres is frequently found to be nearly constant from seedling to flag-leaf expansion if expressed in thermal time units in several grasses (BIRCH et al., 1998BIRCH, C.J. et al. Phyllochron responds to acclimation to temperature and irradiance in maize. Field Crops Res, v.59, p.187-200, 1998. Available from: <Available from: http://dx.doi.org/10.1016/S0378-4290 (98)00120-8 >. Accessed: Dec. 2, 2019. doi: 10.1016/S0378-4290(98)00120-8.
http://dx.doi.org/10.1016/S0378-4290 (98...
). The phyllochron comprises three processes: cell division at the meristem which will give origin to leaf initials; cell division in the intercalary meristem of the expanding leaf primordium; and growth of cells formed by the intercalary meristem, which results in leaf expansion (McMASTER, 2005). Temperature is the most critical environmental factor affecting cell division, and leaf initiation rate is largely determined by the apical bud temperature (SAVVIDES et al., 2016SAVVIDES, A. et al. A unique approach to demonstrating that apical bud temperature specifically determines leaf initiation rate in the dicot Cucumis sativus. Planta, v.243, p.1071-1079, 2016. Available from: <Available from: https://doi.org/10.1007/s00425-015-2464-4 >. Accessed: Jan. 5, 2018. doi: 10.1007/s00425-015-2464-4.
https://doi.org/10.1007/s00425-015-2464-...
). Moreover, the activity of photoreceptors can be affected by temperature (POOAM et al., 2021POOAM, M. et al. Effect of temperature on the arabidopsis cryptochrome photocycle. Physiol. Plantarum, p. 1-9, 2021. Available from: <Available from: https://doi.org/10.1111/ppl.13365 >. Accessed: Mar. 2, 2021. doi: 10.1111/ppl.13365.
https://doi.org/10.1111/ppl.13365...
). A linear relationship between temperature and phyllochron has been observed in the field (McMASTER et al., 2003McMASTER, G.S. et al. Spring wheat leaf appearance and temperature: extending the paradigm? Ann Bot, v.91, p.697-705, 2003. Available from: <Available from: https://doi.org/10.1093/aob/mcg 074 >. Accessed: Jun. 25, 2006. doi:10.1093/aob/mcg074.
https://doi.org/10.1093/aob/mcg 074...
).
We postulate that along the decades the breeding process searching for shorter-cycle plants has altered the environment requirements for apical meristem transition. Therefore, the objectives of this study were to evaluate the phyllochron and the thermal sum to flowering by early cycle oat genotypes developed at different decades at different temperature regimes to verify if the decline in time required for flowering is due to either phyllochron or phytomere number reduction, and their stability at different environments; the effect of high temperature on phytomere development; and identify the plant development stage at the moment of meristem transition.
MATERIALS AND METHODS:
Initially three experiments were developed to calculate the thermal sum to flowering and phyllochron of oat (Avena sativa L.) genotypes. We were interested in the temperature effects therefore we conducted all the experiments under inducible photoperiods for oat. The genotypes used in the experiments are well adapted for cultivation in South America and were developed from 1982 (UFRGS 8) to 2007 (UFRGS 078030-2).
In the first experiment, three oat genotypes, UFRGS 14, URS Guapa and UFRGS 078030-2 were sowed in a greenhouse on May 29th (fall, photoperiod 10 h natural +2 h artificial = 12h light /12h dark) in Porto Alegre, RS, Southern Brazil (30º04’30’’S; 51º08’00’’W). These genotypes were considered early cycle at the time they were developed (Table 1).
In the second experiment, other two genotypes were added, UFRGS 930605-1 and UFRGS 8, totalizing five genotypes. They were sowed in the same greenhouse on October 6th (spring, initial photoperiod 13 h light) to verify the effect of higher temperatures. In the third experiment, the five oat genotypes were cultivated in a growth chamber (Instala Frio®) at temperature of 17± 2 oC and photoperiod of 13 h light (627 µmol m-2 s-1).
In these three experiments, seeds were sowed in pots containing 1.1 kg of substrate (0.5-0.9 mS cm-1; density 330 kg m-3; pH 5.5 to 6.0). Hoagland nutrient solution (50 mL pot-1) was applied every 15 days. The air temperature was measured every 15 min from germination to flowering. Three times a week, the plant development was measured using the methodology described by HAUN (1973HAUN, J.R. Visual quantification of wheat development. Agron J, v.65, p.116-119, 1973. doi:10.2134/agronj1973.00021962006500010035x.
https://doi.org/10.2134/agronj1973.00021...
). Ten biological replicates were used in the first two experiments, and 12 in the third experiment in total randomized design.
The growing degree-days (GDD) were calculated by the following equations:
(1)
(2)
where Tm is the daily average temperature calculated using 96 measurements, Tb is the base temperature below which temperature has no effect on oat development. Based in previous studies (data not shown) Tb equals zero. Top is the optimal temperature in which phytomere development rate is the highest. TH is the maximum temperature above which the phytomere development is arrested; and the temperature accumulation is summed over an interval of days. GDDalt was adapted from ROSA et al. (2009ROSA, H.T. et al. Métodos de soma térmica e datas de semeadura na determinação de filocrono de cultivares de trigo. PAB, v.44, p.1374-82, 2009. Available from: <Available from: https://doi.org/10.1590/ S0 100-204X2009001100002 >. Accessed: May. 3, 2018. doi: 10.1590/S0100-204X2009001100002.
https://doi.org/10.1590/ S0 100-204X2009...
) and calculated using genotype specific TH and Top obtained in the experiment designed to evaluate the effect of high temperature on phytomere development (described below).
Linear regression between GDD or GDDalt and Haun stages was performed for each replicate (STRECK et al., 2007STRECK, N.A. et al. Filocrono de genótipos de arroz irrigado em função de época de semeadura. Ciência Rural, v.37, p.323-329, 2007. Available from: <Available from: https://doi.org/10.1590/S0 103-84782007000200005 >. Accessed: Nov. 6, 2018. doi: 10.1590/ S0103-84782007000200005.
https://doi.org/10.1590/S0 103-847820070...
). The phyllochron was estimated as the inverse of the angular coefficient of these linear regressions (XUE et al., 2004XUE, Q.W. et al. Predicting leaf appearance in field-grown winter wheat: evaluating linear and non-linear models. Ecol Model, v.175, p.261-270, 2004. Available from: <Available from: https://doi.org/10. 1016/j.ecolmodel.2003.10.018 >. Accessed: Mar. 5, 2018. doi: 10.1016/j.ecolmodel.2003.10.018.
https://doi.org/10. 1016/j.ecolmodel.200...
). The simplified thermal sum was calculated as the GDD (eq 1) from emergence to flowering, and compared to the adjusted thermal sum calculated as GDDalt (eq 2). The number of phytomeres was quantified.
To quantify leaf area, plants were grown in a growth chamber as previously described at 17± 2 oC, 13 h light of photoperiod. At flowering, the fully unfolded (ligule apparent) flag leaf and flag leaf-1 were harvested and the area measured using a LI3100C Area meter (Li-cor Biosciences®). Eight biological replicates were used.
To define the Haun stage at which the apical meristem transits from vegetative to reproductive phase, plants were grown at 17± 2 oC, 12 h light of photoperiod. Three times a week the Haun stage was measured, and the meristem of at least three plants per genotype was evaluated for development under optical stereoscope. The meristem stage was defined using Bonnet’s methodology (1966BONNET, O.T. Inflorescences of maize, wheat, rye, barley, and oats: their initiation and development. Agric Exp Station. Bulletin, 721. University of Illinois, Urbana, 1966.), the stage B was considered the beginning of transition. The number of biological replicates was 40.
One last experiment was conducted to evaluate the effect of high temperature on phytomere development. UFRGS 078030-2 (the most precocious), URS Guapa (short cycle) and UFRGS 930605-1 (long cycle) seeds were cultivated in a growth chamber BDW40 (Conviron®) at temperature of 17, 20, 25, 28, 30 and 33 oC at 12 h light. Twelve biological replicates were used in a total randomized design. Three times a week Haun stage was measured; the chronological and thermal time required to develop one leaf was calculated for each temperature. We considered the time from the beginning of leaf appearance up to the moment it was fully unfolded.
Data was submitted to Analysis of Variance and means were compared by Tukey’s test (P ≤0.05), using Statistical Analysis System Enterprise Guide (version 6.1, SAS Institute, USA).
RESULTS AND DISCUSSION:
Plant development is dependent on environmental clues to set its pace; two main clues are photoperiod and temperature (SONG et al., 2013SONG, Y.H. et al. Flowering time regulation: photoperiod-and temperature-sensing in leaves. Trends Plant Sci, v.18, p. 575-583, 2013. Available from: <Available from: https://doi.org/ 10.1016/j.tplants. 2013.05.003 >. Accessed: Jun. 6, 2016. doi: 10.1016/j.tplants.2013.05.003.
https://doi.org/ 10.1016/j.tplants. 2013...
; LIU et al., 2020aLIU, H. et al. Transcriptome profiling reveals phase-specific gene expression in the developing barley inflorescence. Crop J, v. 8, p. 71-86, 2020a. Available from: <Available from: https://doi.org/ 10.1016/j.c j.2019.04.005 >. Accessed: Jan. 5, 2021. doi:10.1016/j.cj.2019.04.005.
https://doi.org/ 10.1016/j.c j.2019.04.0...
). Oat is a long day species but its critical day length has not been quantified (LOSKUTOV et al., 2019). Sensitivity to photoperiod may be variable among the genotypes evaluated (NAVA et al., 2012NAVA, I.C. et al. Tagging and mapping candidate loci for vernalization and flower initiation in hexaploid oat. Mol Breed, v.30, p.1295-1312, 2012. doi: 10.1007/s11032-012-9715-x.
https://doi.org/10.1007/s11032-012-9715-...
). Therefore, a maximum of 12 h dark was provided in all environments aiming at equalizing photoperiod effect. Plant development is dependent on temperature for controlling growth rate as well as the time for meristem transition from the vegetative to the reproductive state (LIU et al., 2020bLIU, L. et al. Florigen trafficking integrates photoperiod and temperature signals in arabidopsis. J Integr Plant Biol, v.62, p.1385-1398, 2020b. Available from: <Available from: https://doi.org/10.1111/jipb. 13000 >. Accessed: Jan. 5, 2021. doi:10.1111/jipb.13000.
https://doi.org/10.1111/jipb. 13000...
). The thermal requirements for leaf development and flowering were analysed for early cycle oat genotypes developed at different decades from 1982 (UFRGS 8) to 2007 (UFRGS 078030-2) and with different DEF. If the oat´s variability in life cycle as species is taken in consideration all used genotypes can be defined as early cycle, but substantial differences in the number of days between sowing and flowering have been observed in Southern Brazilian field conditions.
DEF depends on the environment, for example, in the literature DEF for UFRGS 930605-1 and UFRGS 8 varies from 70 to 127 days and from 46 to 100 days, respectively, mainly because of photoperiod (LOCATELLI et al., 2008LOCATELLI, A.B. et al. Flowering time in oat: Genotype characterization for photoperiod and vernalization response. Field Crops Res, v.106, p.242-247, 2008. doi:10.1016/j.fcr.2007.12.006.
https://doi.org/10.1016/j.fcr.2007.12.00...
). Here, despite the inductive photoperiod, DEF varied among genotypes and environments. UFRGS 078030-2, the last developed genotype, was always the most precocious genotype, while UFRGS 14 and UFRGS 930605-1 required a greater DEF, confirming their higher requirements to transit from vegetative to reproductive stage (Table 1).
In the first experiment (mild temperature) the temperatures ranged from 4.6 oC to 32.6 oC, and GDDalt was equal to GDD. The number of phytomeres was the main factor causing differences in the cycle (Figure 1A). It differed among all cultivars; UFRGS 14 and URS Guapa developed 40% and 27% more phytomeres than UFRGS 078030-2, respectively. The thermal sum required for flowering differed among cultivars. It varied from 1098 oC for UFRGS 14 to 587 oC for UFRGS 078030-2 (Figure 1G). Thermal sum could roughly be the result of phyllochron multiplied by the number of phytomeres. The phyllochron did not differ between UFRGS 078030-2 and URS Guapa (about 100 oC) and was 25 % higher for UFRGS 14 (Figure 1D).

Development of hexaploid oat genotypes at different environments. A, B, C total number of phytomeres; D, E, F phyllochron; G, H, I thermal sum from emergence to flowering stage. A, D, G grown at mild temperatures (sowed in the fall; GDD=GDDalt; N=10); B, E, H grown at high temperatures, gray bars represent means when a linear approach was used to calculate GDD (eq 1) and black filled bars represent means when GDDalt (eq 2) was used considering base, optimal and maximum temperatures for UFRGS 930605-1, URS Guapa and UFRGS 078030-2 (sowed in spring, N=10); and C, F, I grown at constant temperature (17 °C; GDD=GDDalt; N=12); J Area of the flag leaf and flag leaf-1 for oat genotypes contrasting for cycle at constant temperature (17 °C; N=8 plants); K Phenological stage (Haun scale) of oat genotypes grown at 17 °C at apex meristem stage B (transition to floral meristem). Circles and numbers represent the mean and the lines extend from the minimum to the maximum value found (N=40). Small bars represent standard deviation. Different letters indicate significant difference by Tukey’s test (P < 0.05). In J small letters compare genotypes inside flag leaf-1 and capital letters compare inside flag leaf. In E, H small letter compare UFRGS 930605-1, URS Guapa and UFRGS 078030-2 means when GDDalt (eq 2) was used
In the second experiment (high temperature), the temperatures ranged from 11.6 oC to 49.2 oC and differences were found between GDD and GDDalt. When the thermal sum was calculated using GDD (eq.1) it varied among genotypes (gray bars Figure 1H) and was higher than at the first experiment (Figure 1G). The genotypes with greater DEF, UFRGS 930605-1 and UFRGS 14 (Table 1), required similar thermal sum. UFRGS 078030-2 did not differ from URS Guapa, and flowered at the lowest thermal sum (Figure 1H). Taking into account specific optimal and maximum temperatures by using eq.2, the thermal sum was reduced to 1,321± 92; 961±13; and 860 ±25 for UFRGS 930605-1, URS Guapa and UFRGS 078030-2, respectively. The thermal sums were still greater than those obtained at mild temperature but UFRGS 078030-2 slightly differed from URS Guapa (black bars in Figure 1H). Phyllochrons in the high temperature experiment increased in comparison to the mild temperature one if GDD was estimated based on eq1 (Figure 1D-1E) but did not when GDDalt (eq2) was used (black bars in Figure 1E). UFRGS 14 and UFRGS 078030-2´s phyllochrons did not differ from each other at high temperature, despite their contrasting cycle. Interestingly, the phyllochron obtained for UFRGS 930605-1 at high temperature was numerically the smallest despite its high thermal sum at flowering (Figures 1E, 1H). The number of phytomeres did not alter between both environments for UFRGS 14 and UFRGS 078030-2 plants (Figures 1A-1B), however URS Guapa plants reduced from 9.5 in mild to 7.5 phytomeres in high temperature indicating an acceleration in the shoot apical meristem differentiation (Figure 1B). As expected UFRGS 930605-1 plants, with the longest cycle, produced the highest number of phytomeres (12).
In the third experiment performed at constant low temperature (17 oC) the temperatures ranged from 11.4 oC to 20.4 oC and GDDalt was equal to GDD. The genotypes with longer cycle, UFRGS 930605-1 and UFRGS 14, had similar thermal requirements (Figure 1I), about 30 % more than the required by the others. UFRGS 14 had the highest phyllochron, but it did not differ from those obtained for UFRGS 8 and UFRGS 078030-2 (Figure 1F). The number of phytomeres was smaller in UFRGS 8, URS Guapa and UFRGS 078030-2 plants in 17 oC in comparison to the other environments (Figures 1A-1C); and about half the number produced by UFRGS 930605-1 plants.
In the three environments plant cycle length correlated with the number of phytomeres, and thermal sum exhibited a correlation superior to 80 % with the number of phytomeres. Although UFRGS 930605-1 required the highest number of thermal units to flower, its phyllochrons did not differ from those of UFRGS 078030-2, which was always the first to flower and produced fewer phytomeres (Figure 1, Table 1).
The flag leaf was about half the size of the flag leaf-1, and only small differences were found in the area of the flag leaf among genotypes (Figure 1J). UFRGS 930605-1 had the highest number of phytomeres but the smallest area for both leaves, it may be some sort of compensation. This trade was also found for the flag leaf-1; it was superior for UFRGS 078030-2, which produced fewer phytomeres than any other genotype.
The optimum temperature for development may vary inside a species and the rate of leaf initiation and development is affected by temperature (SAVVIDES et al., 2016SAVVIDES, A. et al. A unique approach to demonstrating that apical bud temperature specifically determines leaf initiation rate in the dicot Cucumis sativus. Planta, v.243, p.1071-1079, 2016. Available from: <Available from: https://doi.org/10.1007/s00425-015-2464-4 >. Accessed: Jan. 5, 2018. doi: 10.1007/s00425-015-2464-4.
https://doi.org/10.1007/s00425-015-2464-...
). Suboptimal and supra-optimal temperatures reduce the developmental rate (ATKINSON & PORTER, 1996ATKINSON, D.; PORTER, J.R. Temperature, plant development and crop yields. Trends Plant Sci, v.1, p.119-124, 1996. Available from: <Available from: http://dx.doi.org/10.1016/S1360-1385(96)90006-0 >. Accessed: Nov. 6, 2019. doi: 10.1016/S1360-1385(96)90006-0.
http://dx.doi.org/10.1016/S1360-1385(96)...
), and leaf initiation ceases below the base temperature as well as above a maximum temperature (SÁNCHEZ et al., 2014SÁNCHEZ, B. et al. Temperatures and growth and development of maize and rice: a review. Global Change Biol, v.20, p.408-417, 2014. Available from:<Available from:https://doi.org/10.1111/gcb.12389 >. Accessed: Jun 8, 2018. doi:10.1111/gcb.12389.
https://doi.org/10.1111/gcb.12389 ...
). Here, at high temperatures, both thermal sum and phyllochron increased when a linear approach for calculating GDD was used. In this case, the increase was not associated with a greater number of phytomeres. Indeed, the longer cycle genotypes kept the same number of phytomeres and the earlier cycle genotypes even reduced it at high temperature (Figure 1).
Temperature has been suggested as the major factor affecting phyllochron (CLERGET et al., 2008CLERGET, B. et al.Variability of phyllochron, plastochron and rate of increase in height in photoperiod-sensitive sorghum varieties. Ann Bot, v.101, p.579-594, 2008. Available from: <Available from: https://doi.org/10.1093/aob/mcm327 >. Accessed: Nov. 9, 2020. doi: 10.1093/aob/mcm327.
https://doi.org/10.1093/aob/mcm327...
), which increases at temperatures higher than a species’ specific threshold (CRAUFURD et al., 1998CRAUFURD, P.Q. et al. Effect of temperature on time to panicle initiation and leaf appearance in sorghum. Crop Sci, v. 38, p. 942-947, 1998. Available from: <Available from: https://doi.org/10.2135/cropsci 1998.0011183X003800040011x >. Accessed: Oct. 6, 2019. doi: 10.2135/cropsci1998.0011183X 003800040011x.
https://doi.org/10.2135/cropsci 1998.001...
). The data indicated that after a threshold increases in temperature may not be taken into account by the plant and would not speed up leaf development and might even cease it. Therefore, the linear approach used for calculating thermal sum (GDD), despite being commonly used in the literature, causes a false increase in the thermal units. In wheat, better results have been found when also the optimal and the maximum temperature were considered (ROSA et al., 2009ROSA, H.T. et al. Métodos de soma térmica e datas de semeadura na determinação de filocrono de cultivares de trigo. PAB, v.44, p.1374-82, 2009. Available from: <Available from: https://doi.org/10.1590/ S0 100-204X2009001100002 >. Accessed: May. 3, 2018. doi: 10.1590/S0100-204X2009001100002.
https://doi.org/10.1590/ S0 100-204X2009...
; XUE et al., 2004XUE, Q.W. et al. Predicting leaf appearance in field-grown winter wheat: evaluating linear and non-linear models. Ecol Model, v.175, p.261-270, 2004. Available from: <Available from: https://doi.org/10. 1016/j.ecolmodel.2003.10.018 >. Accessed: Mar. 5, 2018. doi: 10.1016/j.ecolmodel.2003.10.018.
https://doi.org/10. 1016/j.ecolmodel.200...
). For oat those temperatures have not been established yet, we are aware of only one study that estimated the base, optimal and maximum temperatures as 4, 22, and 30 oC, respectively, but it was based on only two cultivars in a one-season field experiment using wheat´s growth coefficients (MANTAI et al., 2017MANTAI, R.D. et al. Simulation of oat development cycle by photoperiod and temperature. Rev Bras eng agric ambient, v.21, p.3-8, 2017. Available from: <Available from: https://doi.org/10.1590/1807-1929 /agriambi.v21n1p3-8 >. Accessed: Jan. 10, 2021. doi: 10.1590/1807-1929/agriambi.v21n1p3-8.
https://doi.org/10.1590/1807-1929 /agria...
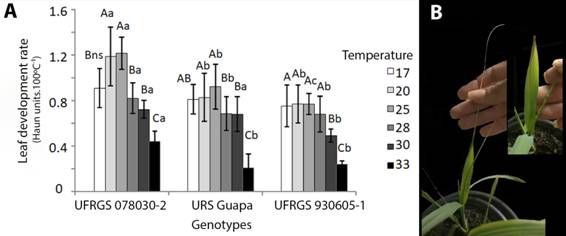
). Leaf development at constant different air temperatures was evaluated here, and maximum (TH) and optimal temperature (Top) defined for three genotypes. UFRGS 930605-1 was the most stable genotype, maintaining a similar rate of leaf development from 17 to 28 oC. But at 30 oC the leaf development rate reduced and the leaf tips withered, at 33oC four out of 12 UFRGS 930605-1 plants arrested leaf development (Figure 2). URS Guapa reached the highest nominal development rate at 25 oC. Aberrant leaves and/or arrested leaf development were observed for 6 out of 12 URS Guapa plants at 33 oC. Withered tips were also detected at 30 oC (Figure 2B). UFRGS 078030-2 increased the leaf development rate from 17 to 25 oC. At 28 oC the rate of leaf development returned to that found at 17 oC, but no leaf development arrest or deformation was detected at any temperature, it suggested greater tolerance to elevated temperature. The cardinal temperatures are in general defined as the same inside a species (SÁNCHEZ et al., 2014SÁNCHEZ, B. et al. Temperatures and growth and development of maize and rice: a review. Global Change Biol, v.20, p.408-417, 2014. Available from:<Available from:https://doi.org/10.1111/gcb.12389 >. Accessed: Jun 8, 2018. doi:10.1111/gcb.12389.
https://doi.org/10.1111/gcb.12389 ...
), but as observed here, differences can be significant among genotypes. Our data suggest the need for specific thresholds for different genotypes.

Leaf development of oat genotypes at different air temperatures. A Leaf development rate, B URS Guapa plants at 30 ºC show withered leaf tips and at 33 Cº (insert) leaf defects. Different capital letters indicate significant difference among temperatures inside each genotype and small letters compare among genotypes at each temperature by Tukey´s test at P≤ 0.05. N=12.
Temperature affects not only phytomere induction and growth rate but also meristem transition (LIN et al., 2020). It has been proposed that high temperatures may lower the level of photoperiodic pathway components required for FLOWERING LOCUS T (FT) transcription in Arabidopsis, and the amount of FT required to induce flowering (FERNÁNDEZ et al., 2016FERNÁNDEZ, V. et al. Photoperiodic and thermosensory pathways interact through CONSTANS to promote flowering at high temperature under short days. Plant J, v.86, p.426-440, 2016. Available from: <Available from: https://doi.org/10.1111/tpj.13183 >. Accessed: Jan. 5, 2017. doi:10.1111/tpj.13183.
https://doi.org/10.1111/tpj.13183...
). FT is a mobile protein transported from the leaves through the phloem to the meristem shoot apex. Its interaction with other proteins causes transcriptional reprogramming of the meristem and activation of downstream genes that leads to the formation of an inflorescence meristem and production of flowers (LIU et al., 2020aLIU, H. et al. Transcriptome profiling reveals phase-specific gene expression in the developing barley inflorescence. Crop J, v. 8, p. 71-86, 2020a. Available from: <Available from: https://doi.org/ 10.1016/j.c j.2019.04.005 >. Accessed: Jan. 5, 2021. doi:10.1016/j.cj.2019.04.005.
https://doi.org/ 10.1016/j.c j.2019.04.0...
). In Brachypodium distachyon, high temperatures were implied in altering the ratios of FT2 variants produced by alternative splicing (QIN et al., 2017QIN, Z. et al. Regulation of FT splicing by an endogenous cue in temperate grasses. Nature Communications, v.8, p.14320, 2017. Available from: <Available from: https://doi.org/10.1038/ncomms14320 >. Accessed: Jul. 5, 2018. doi: 10.1038/ncomms14320.
https://doi.org/10.1038/ncomms14320...
). In addition, it may reduce the activity of floral repressors (FERNÁNDEZ et al., 2016).
The meristem transition from vegetative to reproductive of oat main culm occurred at different Haun developmental stages depending on genotype (Figure 1K). The largest variation inside a genotype was about 0.5 units in the scale, i.e., a half leaf unit for URS Guapa. As expected, the apical meristem of genotypes producing a higher number of phytomeres differentiated later than those from genotypes with a smaller number of phytomeres. The meristem of UFRGS 078030-2 plants transited at Haun stage 2.2 (equivalent to two leaves fully unfolded and 20 % of the third leaf apparent), while the meristem of UFRGS 930605-1 plants transited at 4.6 (four leaves fully unfolded and 60% of the fifth leaf apparent) (Figure 1K). At the same temperature UFRGS 930605-1 plants produced 11 phytomeres and UFRGS 078030-2 plants only five phytomeres.
Flowering time is important for adaptation to specific environments and the resources at this moment are essential for guaranteeing high yields. For example, nitrogen limitation during transition and differentiation of the floral meristem reduces the number of flowers and limits potential yield (MUNDSTOCK & BREDEMEIER, 2001MUNDSTOCK, C.M., BREDEMEIER, C. Disponibilidade de nitrogênio e sua relação com o afilhamento e o rendimento de grãos de aveia. Ciência Rural, v.31, p.205-211, 2001. doi: 10.1590/S0103-84782001000200003.
https://doi.org/10.1590/S0103-8478200100...
). In grasses, the shoot meristem apex is enveloped by the leaves, therefore, meristem transition identification relies on its association to developmental stages/morphological characteristics (HAUN, 1973HAUN, J.R. Visual quantification of wheat development. Agron J, v.65, p.116-119, 1973. doi:10.2134/agronj1973.00021962006500010035x.
https://doi.org/10.2134/agronj1973.00021...
). In oat, it had been described that the meristem switch occurred between 4.0 and 7.6 in the Haun scale (LAITANO, 1997LAITANO, C.S. Desenvolvimento do meristema apical de aveia e trigo e sua relação com características morfológicas. Federal University of Rio Grande do Sul. 1997.), but the search for precocious genotypes altered this relationship. For UFRGS 14 the meristem transition was reported between 4.3 and 6.4 (LAITANO, 1997), here it occurred between 4.0 and 4.4, the difference may be due to a more stable environment. Here the plants were grown at constant temperature (17 oC) and photoperiod (12 hours) whereas LAITANO (1997) grew them in the field. For shorter cycle genotypes transition was much earlier. For instance, the meristem of UFRGS 078030-2 plants transited between 2.0 and 2.4. This behaviour may require higher nitrogen inputs at sowing to guarantee no limitation during floral meristem differentiation and consequently high yields. For later genotypes as UFRGS 14 and UFRGS 930605-1 nitrogen rate can be split between sowing and 5.0 in the Haun scale.
In conclusion, the breeding effort to reduce cycle length has reduced the number of phytomeres by the attenuation of requirements for the shoot meristem to transit to reproductive stage. Elevated temperatures, not only may not be computed by the plant, but also may cause development arrest. In order to correctly address the relation between development and temperature, the oat´s cardinal temperatures must be taken into account but they may be genotype dependent. Here, UFRGS 078030-2 was the most resilient genotype.
REFERENCES
- ATKINSON, D.; PORTER, J.R. Temperature, plant development and crop yields. Trends Plant Sci, v.1, p.119-124, 1996. Available from: <Available from: http://dx.doi.org/10.1016/S1360-1385(96)90006-0 >. Accessed: Nov. 6, 2019. doi: 10.1016/S1360-1385(96)90006-0.
» https://doi.org/10.1016/S1360-1385(96)90006-0.» http://dx.doi.org/10.1016/S1360-1385(96)90006-0 - BIRCH, C.J. et al. Phyllochron responds to acclimation to temperature and irradiance in maize. Field Crops Res, v.59, p.187-200, 1998. Available from: <Available from: http://dx.doi.org/10.1016/S0378-4290 (98)00120-8 >. Accessed: Dec. 2, 2019. doi: 10.1016/S0378-4290(98)00120-8.
» https://doi.org/10.1016/S0378-4290(98)00120-8.» http://dx.doi.org/10.1016/S0378-4290 (98)00120-8 - BONNET, O.T. Inflorescences of maize, wheat, rye, barley, and oats: their initiation and development. Agric Exp Station. Bulletin, 721. University of Illinois, Urbana, 1966.
- CLERGET, B. et al.Variability of phyllochron, plastochron and rate of increase in height in photoperiod-sensitive sorghum varieties. Ann Bot, v.101, p.579-594, 2008. Available from: <Available from: https://doi.org/10.1093/aob/mcm327 >. Accessed: Nov. 9, 2020. doi: 10.1093/aob/mcm327.
» https://doi.org/10.1093/aob/mcm327.» https://doi.org/10.1093/aob/mcm327 - CRAUFURD, P.Q. et al. Effect of temperature on time to panicle initiation and leaf appearance in sorghum. Crop Sci, v. 38, p. 942-947, 1998. Available from: <Available from: https://doi.org/10.2135/cropsci 1998.0011183X003800040011x >. Accessed: Oct. 6, 2019. doi: 10.2135/cropsci1998.0011183X 003800040011x.
» https://doi.org/10.2135/cropsci1998.0011183X 003800040011x.» https://doi.org/10.2135/cropsci 1998.0011183X003800040011x - FERNÁNDEZ, V. et al. Photoperiodic and thermosensory pathways interact through CONSTANS to promote flowering at high temperature under short days. Plant J, v.86, p.426-440, 2016. Available from: <Available from: https://doi.org/10.1111/tpj.13183 >. Accessed: Jan. 5, 2017. doi:10.1111/tpj.13183.
» https://doi.org/10.1111/tpj.13183» https://doi.org/10.1111/tpj.13183 - HAUN, J.R. Visual quantification of wheat development. Agron J, v.65, p.116-119, 1973. doi:10.2134/agronj1973.00021962006500010035x.
» https://doi.org/10.2134/agronj1973.00021962006500010035x - LAITANO, C.S. Desenvolvimento do meristema apical de aveia e trigo e sua relação com características morfológicas. Federal University of Rio Grande do Sul. 1997.
- LOCATELLI, A.B. et al. Flowering time in oat: Genotype characterization for photoperiod and vernalization response. Field Crops Res, v.106, p.242-247, 2008. doi:10.1016/j.fcr.2007.12.006.
» https://doi.org/10.1016/j.fcr.2007.12.006 - LOSTUKOV, I. G. et al. Diversity of photoperiodic responses in oats. Vavilov J Genet Breed, v. 23, p. 723-729, 2019. Available from: <Available from: https://doi.org/10.18699/VJ19.546 >. Accessed: Nov. 7, 2020. doi:10.18699/VJ19.546.
» https://doi.org/10.18699/VJ19.546» https://doi.org/10.18699/VJ19.546 - LIU, H. et al. Transcriptome profiling reveals phase-specific gene expression in the developing barley inflorescence. Crop J, v. 8, p. 71-86, 2020a. Available from: <Available from: https://doi.org/ 10.1016/j.c j.2019.04.005 >. Accessed: Jan. 5, 2021. doi:10.1016/j.cj.2019.04.005.
» https://doi.org/0.1016/j.cj.2019.04.005.» https://doi.org/ 10.1016/j.c j.2019.04.005 - LIU, L. et al. Florigen trafficking integrates photoperiod and temperature signals in arabidopsis. J Integr Plant Biol, v.62, p.1385-1398, 2020b. Available from: <Available from: https://doi.org/10.1111/jipb. 13000 >. Accessed: Jan. 5, 2021. doi:10.1111/jipb.13000.
» https://doi.org/10.1111/jipb.13000» https://doi.org/10.1111/jipb. 13000 - MANTAI, R.D. et al. Simulation of oat development cycle by photoperiod and temperature. Rev Bras eng agric ambient, v.21, p.3-8, 2017. Available from: <Available from: https://doi.org/10.1590/1807-1929 /agriambi.v21n1p3-8 >. Accessed: Jan. 10, 2021. doi: 10.1590/1807-1929/agriambi.v21n1p3-8.
» https://doi.org/10.1590/1807-1929/agriambi.v21n1p3-8.» https://doi.org/10.1590/1807-1929 /agriambi.v21n1p3-8 - McMASTER, G.S. Phytomers, phyllochrons, phenology and temperate cereal development. J Agric Sci, v.143, p.137-150, 2005. Available from: <Available from: https://doi.org/10.1017/S00218596050050 83 >. Accessed: Jan. 15, 2018. doi:10.1017/S0021859605005083.
» https://doi.org/10.1017/S0021859605005083» https://doi.org/10.1017/S00218596050050 83 - McMASTER, G.S. et al. Spring wheat leaf appearance and temperature: extending the paradigm? Ann Bot, v.91, p.697-705, 2003. Available from: <Available from: https://doi.org/10.1093/aob/mcg 074 >. Accessed: Jun. 25, 2006. doi:10.1093/aob/mcg074.
» https://doi.org/10.1093/aob/mcg074» https://doi.org/10.1093/aob/mcg 074 - MUNDSTOCK, C.M., BREDEMEIER, C. Disponibilidade de nitrogênio e sua relação com o afilhamento e o rendimento de grãos de aveia. Ciência Rural, v.31, p.205-211, 2001. doi: 10.1590/S0103-84782001000200003.
» https://doi.org/10.1590/S0103-84782001000200003 - NAVA, I.C. et al. Tagging and mapping candidate loci for vernalization and flower initiation in hexaploid oat. Mol Breed, v.30, p.1295-1312, 2012. doi: 10.1007/s11032-012-9715-x.
» https://doi.org/10.1007/s11032-012-9715-x - POOAM, M. et al. Effect of temperature on the arabidopsis cryptochrome photocycle. Physiol. Plantarum, p. 1-9, 2021. Available from: <Available from: https://doi.org/10.1111/ppl.13365 >. Accessed: Mar. 2, 2021. doi: 10.1111/ppl.13365.
» https://doi.org/10.1111/ppl.13365.» https://doi.org/10.1111/ppl.13365 - QIN, Z. et al. Regulation of FT splicing by an endogenous cue in temperate grasses. Nature Communications, v.8, p.14320, 2017. Available from: <Available from: https://doi.org/10.1038/ncomms14320 >. Accessed: Jul. 5, 2018. doi: 10.1038/ncomms14320.
» https://doi.org/10.1038/ncomms14320.» https://doi.org/10.1038/ncomms14320 - ROSA, H.T. et al. Métodos de soma térmica e datas de semeadura na determinação de filocrono de cultivares de trigo. PAB, v.44, p.1374-82, 2009. Available from: <Available from: https://doi.org/10.1590/ S0 100-204X2009001100002 >. Accessed: May. 3, 2018. doi: 10.1590/S0100-204X2009001100002.
» https://doi.org/10.1590/S0100-204X2009001100002.» https://doi.org/10.1590/ S0 100-204X2009001100002 - SÁNCHEZ, B. et al. Temperatures and growth and development of maize and rice: a review. Global Change Biol, v.20, p.408-417, 2014. Available from:<Available from:https://doi.org/10.1111/gcb.12389 >. Accessed: Jun 8, 2018. doi:10.1111/gcb.12389.
» https://doi.org/10.1111/gcb.12389» https://doi.org/10.1111/gcb.12389 - SAVVIDES, A. et al. A unique approach to demonstrating that apical bud temperature specifically determines leaf initiation rate in the dicot Cucumis sativus Planta, v.243, p.1071-1079, 2016. Available from: <Available from: https://doi.org/10.1007/s00425-015-2464-4 >. Accessed: Jan. 5, 2018. doi: 10.1007/s00425-015-2464-4.
» https://doi.org/10.1007/s00425-015-2464-4.» https://doi.org/10.1007/s00425-015-2464-4 - SONG, Y.H. et al. Flowering time regulation: photoperiod-and temperature-sensing in leaves. Trends Plant Sci, v.18, p. 575-583, 2013. Available from: <Available from: https://doi.org/ 10.1016/j.tplants. 2013.05.003 >. Accessed: Jun. 6, 2016. doi: 10.1016/j.tplants.2013.05.003.
» https://doi.org/10.1016/j.tplants.2013.05.003.» https://doi.org/ 10.1016/j.tplants. 2013.05.003 - STRECK, N.A. et al. Filocrono de genótipos de arroz irrigado em função de época de semeadura. Ciência Rural, v.37, p.323-329, 2007. Available from: <Available from: https://doi.org/10.1590/S0 103-84782007000200005 >. Accessed: Nov. 6, 2018. doi: 10.1590/ S0103-84782007000200005.
» https://doi.org/10.1590/ S0103-84782007000200005.» https://doi.org/10.1590/S0 103-84782007000200005 - WALDOW, D.A.G. Genetic progress of yield and related agronomic characters in oat. Federal University of Rio Grande do Sul, 2012.
- XUE, Q.W. et al. Predicting leaf appearance in field-grown winter wheat: evaluating linear and non-linear models. Ecol Model, v.175, p.261-270, 2004. Available from: <Available from: https://doi.org/10. 1016/j.ecolmodel.2003.10.018 >. Accessed: Mar. 5, 2018. doi: 10.1016/j.ecolmodel.2003.10.018.
» https://doi.org/10.1016/j.ecolmodel.2003.10.018.» https://doi.org/10. 1016/j.ecolmodel.2003.10.018
-
CR-2021-0198.R1
Editors:
Publication Dates
-
Publication in this collection
01 Sept 2021 -
Date of issue
2022
History
-
Received
12 Mar 2021 -
Accepted
07 Apr 2021 -
Reviewed
01 June 2021