
Abstract:
The objective of this work was to compare methods of obtaining the site index for eucalyptus (Eucalyptus spp.) stands, as well as to evaluate their impact on the stability of this index in databases with and without outliers. Three methods were tested, using linear regression, quantile regression, and artificial neural network. Twenty-two permanent plots from a continuous forest inventory were used, measured in trees with ages from 23 to 83 months. The outliers were identified using a boxplot graphic. The artificial neural network showed better results than the linear and quantile regressions, both for dominant height and site index estimates. The stability obtained for the site index classification by the artificial neural network was also better than the one obtained by the other methods, regardless of the presence or the absence of outliers in the database. This shows that the artificial neural network is a solid modelling technique in the presence of outliers. When the cause of the presence of outliers in the database is not known, they can be kept in it if techniques as artificial neural networks or quantile regression are used.
Index terms:
Eucalyptus; artificial intelligence; dominant height; forest inventory; forest modelling; non-sampling errors
Resumo:
O objetivo deste trabalho foi comparar métodos para obtenção do índice de sítio para povoamentos de eucalipto (Eucalyptus spp.), bem como avaliar seus impactos na estabilidade desse índice em bases de dados com e sem a presença de “outliers”. Foram testados três métodos, com uso de regressão linear, regressão quantílica e rede neural artificial. Foram utilizadas 22 parcelas permanentes de inventário florestal contínuo, medidas em árvores com idade de 23 a 83 meses. Os outliers foram identificados com uso de gráfico de boxplot. A rede neural artificial proporcionou melhores resultados que as regressões linear e quantílica, tanto para as estimativas de altura dominante quanto do índice de sítio. A estabilidade da classificação do índice de sítio obtida pela rede neural artificial também foi melhor que a obtida com os outros métodos, independentemente da presença ou da ausência de outliers na base de dados. Isso indica que a rede neural artificial é uma técnica sólida de modelagem na presença de outliers. Quando a causa da presença de outliers na base de dados não é conhecida, eles podem ser mantidos nela se técnicas como as de redes neurais artificiais ou de regressão quantílica forem utilizadas.
Termos para indexação:
Eucalyptus; inteligência artificial; altura dominante; inventário florestal; modelagem florestal; erros não amostrais
Introduction
Understanding growth and yield processes in forests is important to their rational management (Cosenza et al., 2015COSENZA, D.N.; LEITE, H.G.; MARCATTI, G.E.; BINOTI, D.H.B.; ALCÂNTARA, A.E.M. de; RODE, R. Classificação da capacidade produtiva de sítios florestais utilizando máquina de vetor de suporte e rede neural artificial. Scientia Forestalis, v.43, p.955-963, 2015. DOI: https://doi.org/10.18671/scifor.v43n108.19.
https://doi.org/10.18671/scifor.v43n108....
). Statistical techniques for data modelling can support decision making during forest planning, and information on site productive capacity can help delineating resource allocation strategies for management units, silvicultural treatments, and wood volume prognosis (Campos & Leite, 2017CAMPOS, J.C.C.; LEITE, H.G. Mensuração florestal: perguntas e respostas. 5.ed. atual. e ampl. Viçosa: Ed. da UFV, 2017. 636p.).
The potential for trees to grow at a specific location can be determined by site index estimates, obtained by direct or indirect methods (Binoti et al., 2012BINOTI, D.H.B.; BINOTI, M.L.M. da S.; LEITE, H.G. Aplicação da função hiperbólica na construção de curvas de índice de local. Revista Árvore, v.36, p.741-746, 2012. DOI: https://doi.org/10.1590/S0100-67622012000400015.
https://doi.org/10.1590/S0100-6762201200...
). Among direct methods, the guide-curve is the most commonly used, whose application includes the adjustment of regression models that relate dominant height and forest age data (Scolforo, 2006SCOLFORO, J.R.S. Biometria florestal: modelos de crescimento e produção florestal. Lavras: UFLA, 2006. 393p.). When this procedure is used for the classification of site productive capacity, its evaluation generally includes the stability analysis (Machado et al., 2011MACHADO, S. do A.; SOUZA, R.F. de; JASKIU, E.; CAVALHEIRO, R. Construction of site curves for native Mimosa scabrella stands in the metropolitan region of Curitiba. Cerne, v.17, p.489-497, 2011. DOI: https://doi.org/10.1590/S0104-77602011000400007.
https://doi.org/10.1590/S0104-7760201100...
), which deals with the estimation of the number of plots (or samples) that remain in the same site index class over time.
Databases used for dominant height modelling in forest stands are obtained from permanent or temporary plots, during a forest inventory, or from stem analyses (Scolforo, 1997SCOLFORO, J.R.S. Biometria florestal: módulo 3: métodos para classificação de sítios florestais. Lavras: UFLA, 1997. 151p.). These measurements, although simple, must be done carefully in order to avoid non-sampling errors (Soares et al., 2011SOARES, C.P.B.; PAULA NETO, F. de; SOUZA, A.L. de. Dendrometria e inventário florestal. 2.ed. Viçosa: Ed. da UFV, 2011. 272p.), which can impact the analysis when one or more values are out of the general trend of the data and are considered as outliers. Because of their marked difference, according to Santos et al. (2015)SANTOS, A.J.A.; ANJOS, O.; PEREIRA, H. Estimation of Acacia melanoxylon unbleached Kraft pulp brightness by NIR spectroscopy. Forest Systems, v.24, eRC03, 2015. DOI: https://doi.org/10.5424/fs/2015242-07580.
https://doi.org/10.5424/fs/2015242-07580...
, the number of outliers should be as low as possible. There are several ways to identify them, among which stands out the boxplot graphic (Schwertman et al., 2004SCHWERTMAN, N.C.; OWENS, M.A.; ADNAN, R. A simple more general boxplot method for identifying outliers. Computational Statistics & Data Analysis, v.47, p.165-174, 2004. DOI: https://doi.org/10.1016/j.csda.2003.10.012.
https://doi.org/10.1016/j.csda.2003.10.0...
).
It should be noted that sometimes outliers are not measurement errors, but values with a different distribution. In these cases, a deep evaluation about the cause of their discrepant behaviour is necessary before excluding them from database. In other situations, the set of discrepant data can result in new strata for modelling. When the analysis of their origin is not possible, due to the amount of data or to the impossibility of assessing sampling procedures, it is important to keep the outliers in the database. Therefore, mathematical techniques suitable for other types of distribution are required to incorporate these values into the database, aiming at a robust modelling process, without the possibility of phasing out real information, although discrepant.
The use of the quantile regression (QR) and artificial neural network (ANN) is common for this kind of robust modelling. The first type of analysis was proposed by Koenker & Basset (1978)KOENKER, R.; BASSETT JR., G. Regression quantiles. Econometrica, v.46, p.33-50, 1978. and is rather robust when there are outliers in the database, since they have no effect on the distribution of the conditional median and can be used to model any specified quantile of a dataset (Abellanas et al., 2016ABELLANAS, B.; ABELLANAS, M.; POMMERENING, A.; LODARES, D.; CUADROS, S. A forest simulation approach using weighted Voronoi diagrams. An application to Mediterranean fir Abies pinsapo Boiss stands. Forest Systems, v.25, p.1-16, 2016. DOI: https://doi.org/10.5424/fs/2016252-08021.
https://doi.org/10.5424/fs/2016252-08021...
). The second is part of the artificial intelligence field. It was firstly described by McCulloch & Pitts (1943)MCCULLOCH, W.S.; PITTS, W. A logical calculus of the ideas immanent in nervous activity. Bulletin of Mathematical Biophysics, v.5, p.115-133, 1943. DOI: https://doi.org/10.1007/BF02478259.
https://doi.org/10.1007/BF02478259...
and has been considered as an excellent alternative to the traditional regression models. Both the QR and ANN have already been used with success to fit dominant height data, with focus on site index estimates (Cosenza et al., 2015COSENZA, D.N.; LEITE, H.G.; MARCATTI, G.E.; BINOTI, D.H.B.; ALCÂNTARA, A.E.M. de; RODE, R. Classificação da capacidade produtiva de sítios florestais utilizando máquina de vetor de suporte e rede neural artificial. Scientia Forestalis, v.43, p.955-963, 2015. DOI: https://doi.org/10.18671/scifor.v43n108.19.
https://doi.org/10.18671/scifor.v43n108....
; Araújo Júnior et al., 2016ARAÚJO JÚNIOR, C.A.; SOARES, C.P.B.; LEITE, H.G. Curvas de índices de local em povoamentos de eucalipto obtidas por regressão quantílica. Pesquisa Agropecuária Brasileira, v.51, p.720-727, 2016. DOI: https://doi.org/10.1590/S0100-204X2016000600003.
https://doi.org/10.1590/S0100-204X201600...
); however, these studies did not consider the presence of outliers in the database.
The objective of this work was to compare methods of obtaining the site index for eucalyptus stands, as well as to evaluate their impact on the stability of this index in databases with and without outliers.
Materials and Methods
The study was developed using data from 22 rectangular, permanent plots (approximately 330 m2) of a continuous forest inventory carried out in forest stands in the Vale do Rio Doce region, in the east of the state of Minas Gerais, Brazil. Measurements were done in trees with ages from 20 to 83 months, with six observations per plot. Dominant height was obtained for each measurement, considering the average height of the 100 largest trees per hectare, and diameter at breast height was determined as in Assman (1970)ASSMAN, E. The principles of forest yield study: studies in the organic production, structure, increment and yield of forest stands. Oxford: Pergamon Press, 1970. 506p.. Descriptive statistics are shown in Table 1.
Observations were grouped according to age classes, with a 12-month range, in order to identify possible discrepant data. A boxplot was built for each age class, and data out of the confidence interval were considered as outliers, as proposed by Schwertman et al. (2004)SCHWERTMAN, N.C.; OWENS, M.A.; ADNAN, R. A simple more general boxplot method for identifying outliers. Computational Statistics & Data Analysis, v.47, p.165-174, 2004. DOI: https://doi.org/10.1016/j.csda.2003.10.012.
https://doi.org/10.1016/j.csda.2003.10.0...
. Therefore, two databases were created: one containing outliers and another without them.
Schumacher’s model was adjusted for each database, as in Demolinari et al. (2007)DEMOLINARI, R.A.; SOARES, C.P.B.; LEITE, H.G.; SOUZA, A.L. de. Crescimento de plantios clonais de eucalipto não desbastados na região de Monte Dourado (PA). Revista Árvore, v.31, p.503-512, 2007. DOI: https://doi.org/10.1590/S0100-67622007000300016.
https://doi.org/10.1590/S0100-6762200700...
, and is described as: , where H is the dominant height (meters); A is the age of the trees at measurement (months); β0 and β1 are parameters; Ln is the natural logarithm; and ε is the random error, with ε ~ NID (0, σ2). For Schumacher’s model, the adjustment was done with the ordinary least square method and with the minimization of the absolute error for the QR (Araújo Júnior et al., 2016ARAÚJO JÚNIOR, C.A.; SOARES, C.P.B.; LEITE, H.G. Curvas de índices de local em povoamentos de eucalipto obtidas por regressão quantílica. Pesquisa Agropecuária Brasileira, v.51, p.720-727, 2016. DOI: https://doi.org/10.1590/S0100-204X2016000600003.
https://doi.org/10.1590/S0100-204X201600...
), using the following equations:
where n is the number of observations; ρτ is the weight for residual i, determined as 2q (quantile) if ri>0 or 2 (1 - q) if otherwise; ri is the residual for the ith observation; yi is the ith observed value; k is the number of parameters to be estimated; xij is the value of the jth independent variable for the ith observed data; and βj is the jth parameter to be estimated.
For the QR method, a percentile of 50% (median) was considered. In this case, the adjustment was made using the quantreg statistical package (Koenker, 2013KOENKER, R. quantreg: quantile regression. R package version 5.05. 2013. Available at: <Available at: http://CRAN.R-project.org/package=quantreg
>. Accessed on: Jan. 15 2018.
http://CRAN.R-project.org/package=quantr...
), developed for the R software (R Core Team, 2014R CORE TEAM. R: a language and environment for statistical computing. Vienna: R Foundation for Statistical Computing, 2014.).
The two databases were, then, used for training the ANN, considering a multilayer perceptron structure, with age as an input variable and dominant height as an output variable. ANN training was carried out using the resilient propagation algorithm, 5 neurons in the hidden layer and 3,000 epochs of training; these parameters were defined according to Binoti et al. (2015)BINOTI, M.L.M. da S.; LEITE, H.G.; BINOTI, D.H.B.; GLERIANI, J.M. Prognose em nível de povoamento de clones de eucalipto empregando redes neurais artificiais. Cerne, v.21, p.97-105, 2015. DOI: https://doi.org/10.1590/01047760201521011153.
https://doi.org/10.1590/0104776020152101...
. The NeuroForest software was used to obtain ANN parameters (Binoti et al., 2014BINOTI, D.H.B.; BINOTI, M.L.M. da S.; LEITE, H.G. Configuração de redes neurais artificiais para estimação do volume de árvores. Ciência da Madeira, v.5, p.58-67, 2014. DOI: https://doi.org/10.12953/2177-6830.v05n01a06.
https://doi.org/10.12953/2177-6830.v05n0...
).
The average percentage relative error (EAPR), the mean absolute error (MAE), the root mean square error (RMSE), and the correlation coefficient between observed and estimated values (ryŷ) were used to evaluate the quality of the adjustments. In addition, histograms of the EAPR for each method were built. The estimated parameters were obtained with the following equations:
where n is the total number of observations, ŷi is the estimated value for observation i, yi is the correspondent observed value, cov is the covariance, and var is the variance. The estimated parameters for the QR and linear regression (LR) were evaluated by the t-test, at 5% probability.
The guide-curve method, applying a reference age of 72 months to Schumacher’s model, was used to determine the site index using the estimates obtained from the LR and QR models (Campos & Leite, 2017CAMPOS, J.C.C.; LEITE, H.G. Mensuração florestal: perguntas e respostas. 5.ed. atual. e ampl. Viçosa: Ed. da UFV, 2017. 636p.), through the equation: , where S is the site index value (meters), H is the dominant height (meters), A is the age at measurement time (months), and IA is the index age (months).
A new training - considering a data structure similar to the one used for Schumacher’s model - was performed to obtain the site index by a neural network. Therefore, the ANN was trained considering a multilayer perceptron structure. Dominant height at the current age, current age, and future age were considered as input variables, and dominant height at a future age, as an output variable. The trained ANN was applied using the index age of 72 months as the future age in order to obtain the site index for each measurement.
The site index estimates obtained from the LR, QR, and ANN were classified using the equation:
where int is a function that returns the integer value of a real number, S is the site index estimated for each plot in each measurement time, and R is the range of class (meters) considered. This equation returns the central value of the class as a function of the class range - in this study, an interval equal to 5.0 m was considered.
The results of the classification of productive capacity using the site index were subjected to the stability analysis, as suggested by Scolforo (2006)SCOLFORO, J.R.S. Biometria florestal: modelos de crescimento e produção florestal. Lavras: UFLA, 2006. 393p. and Chaves et al. (2016)CHAVES, A.G.S.; DRESCHER, R.; CALDEIRA, S.F.; MARTINEZ, D.T.; VENDRUSCOLO, D.G.S. Capacidade produtiva de Tectona grandis L.f no Sudoeste de Mato Grosso. Scientia Forestalis, v.44, p.415-424, 2016. DOI: https://doi.org/10.18671/scifor.v44n110.14.
https://doi.org/10.18671/scifor.v44n110....
. In this case, five intervals of last measurements were considered: interval 1, measurements from 1 to 6; interval 2, from 2 to 6; interval 3, from 3 to 6; interval 4, from 4 to 6; and interval 5, from 5 to 6. The amount of plots that remained in a same class, in all measurements, was counted for each range. Stability was obtained from the percentage of stable plots.
Results and Discussion
Using a boxplot, six outliers, all located bellow data distribution, were detected for each dominant height measurement period (Figure 1). When the presence of outliers is as strong as the one observed here, considering them in modelling generally enhances database consistency. It should be highlighted that, on the one hand, their use may cause a loss in the explanatory power of regression models (Schwertman et al., 2004SCHWERTMAN, N.C.; OWENS, M.A.; ADNAN, R. A simple more general boxplot method for identifying outliers. Computational Statistics & Data Analysis, v.47, p.165-174, 2004. DOI: https://doi.org/10.1016/j.csda.2003.10.012.
https://doi.org/10.1016/j.csda.2003.10.0...
), whereas, on the other hand, it can completely change the analysis if the causes for their presence cannot be determined.
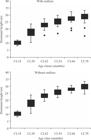
Boxplot graphics for the variables dominant height and age class of eucalyptus (Eucalyptus spp.) stands from databases with and without outliers. Age class was measured with a 12-month range (CL18 to CL78).
The boxplot analysis did not evidence discrepant observations after the exclusion of the outliers (Figure 1). The comparison of databases with and without outliers indicated little discrepancy for the averages and medians, in each class of dominant height (Table 2).
Considering Schumacher’s model for the two databases, the adjusted equations generated parameters statistically different from zero (p<0.05), both for the LR and QR (Table 3). It is possible to note that the values obtained for the parameters using the different methods differed in the database with outliers, but were similar in the one without them. This result is due to the fact that the LR is less tolerant to the presence of noise than the QR (Araújo Júnior et al., 2016ARAÚJO JÚNIOR, C.A.; SOARES, C.P.B.; LEITE, H.G. Curvas de índices de local em povoamentos de eucalipto obtidas por regressão quantílica. Pesquisa Agropecuária Brasileira, v.51, p.720-727, 2016. DOI: https://doi.org/10.1590/S0100-204X2016000600003.
https://doi.org/10.1590/S0100-204X201600...
), mainly when the discrepant values promote a change in average values, but interfere little in the median, as was the case for some dominant height classes (Table 2).
Graphically, it is possible to observe a discrepancy between the curves for the values estimated by the LR and QR only when there are outliers in the database (Figure 2). This is in alignment with the results from Araújo Júnior et al. (2016)ARAÚJO JÚNIOR, C.A.; SOARES, C.P.B.; LEITE, H.G. Curvas de índices de local em povoamentos de eucalipto obtidas por regressão quantílica. Pesquisa Agropecuária Brasileira, v.51, p.720-727, 2016. DOI: https://doi.org/10.1590/S0100-204X2016000600003.
https://doi.org/10.1590/S0100-204X201600...
, who reported a dislocation of the curve in the direction of the outliers. These variations can promote imprecise values, mainly when there are no guarantees that the outliers really must be part of the sampling.
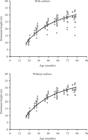
Schumacher’s model adjusted considering the quantile (continuous line) and linear (dotted line) regressions for the variables dominant height and age class of eucalyptus (Eucalyptus spp.) stands from databases with and without outliers.
The statistics for regression and for the ANN (Table 4) reveal better MAE, RSME, and ryŷ values for the latter, which showed greater robustness in estimating dominant height values. The QR had a slightly superior adjustment than the LR, which was also found by Araújo Júnior et al. (2016)ARAÚJO JÚNIOR, C.A.; SOARES, C.P.B.; LEITE, H.G. Curvas de índices de local em povoamentos de eucalipto obtidas por regressão quantílica. Pesquisa Agropecuária Brasileira, v.51, p.720-727, 2016. DOI: https://doi.org/10.1590/S0100-204X2016000600003.
https://doi.org/10.1590/S0100-204X201600...
.
When the database had no outliers, the statistics were improved, compared with the previous analysis (Table 4). However, the order of the quality of the adjustment remained the same, i.e., the ANN results were superior to the ones obtained by the QR and LR. Indeed, recent literature shows accuracy gains due to the adoption of neural networks instead of classic regression models (Binoti et al., 2015BINOTI, M.L.M. da S.; LEITE, H.G.; BINOTI, D.H.B.; GLERIANI, J.M. Prognose em nível de povoamento de clones de eucalipto empregando redes neurais artificiais. Cerne, v.21, p.97-105, 2015. DOI: https://doi.org/10.1590/01047760201521011153.
https://doi.org/10.1590/0104776020152101...
; Miguel et al., 2015MIGUEL, E.P.; REZENDE, A.V.; LEAL, F.A.; MATRICARDI, E.A.T.; VALE, A.T. do; PEREIRA, R.S. Redes neurais artificiais para a modelagem do volume de madeira e biomassa do cerradão com dados de satélite. Pesquisa Agropecuária Brasileira, v.50, p.829-839, 2015. DOI: https://doi.org/10.1590/S0100-204X2015000900012.
https://doi.org/10.1590/S0100-204X201500...
).
The histograms of the estimated values from the database with outliers showed errors above 50% (Figure 3). Even when techniques considered robust to outliers, such as the QR and ANN, were used, errors still occurred at high levels. This can be explained by the behaviour of the techniques that consider outliers - or give them a great importance - when modelling a denser set of data.

Histograms of relative percentage error (EAPR) for dominant height estimates according to eucalyptus (Eucalyptus spp.) plant age, considering different methods and the presence or absence of outliers in the database. LR, linear regression; QR, quantile regression; and ANN, artificial neural network.
Considering the second ANN, trained to obtain the values of dominant height at a future age, errors between -20 and +30% were observed (Figure 4), as well as EAPR, MAE, and RSME values near zero for databases with and without outliers (Table 5). The difference between the estimates of the two ANNs can be attributed to the projection of the dominant height in the second one, where the neural network output (dominant height at a future age) was dependent on the dominant height at the current age. This might provide a better learning to the ANN, compared with the patterns of inputs and outputs of the system. These results agree with those found by Cosenza et al. (2015)COSENZA, D.N.; LEITE, H.G.; MARCATTI, G.E.; BINOTI, D.H.B.; ALCÂNTARA, A.E.M. de; RODE, R. Classificação da capacidade produtiva de sítios florestais utilizando máquina de vetor de suporte e rede neural artificial. Scientia Forestalis, v.43, p.955-963, 2015. DOI: https://doi.org/10.18671/scifor.v43n108.19.
https://doi.org/10.18671/scifor.v43n108....
, who pointed out that the classification of productive capacity using neural networks provided consistent results, superior to those observed with the application of a support machine vector.

Histograms of relative percentage error (EAPR) for the artificial neural network estimates, used to classify the productive capacity of the eucalyptus (Eucalyptus spp.) site, with and without outliers in the database.
The analysis of site classification stability showed that the ANN provided good results, both for databases with and without outliers, especially when six or five measurements were considered (Figure 5). This reinforces the quality of the estimates obtained with this technique, mainly for the dominant height ranges, for which a lower stability is expected. The LR provided good estimates when less than four measurements were considered. The worse results were observed for the QR (six measurements) when the outliers were excluded; however, when they were considered, this regression provided good results. When low amounts of measurements are available, the percentage of stable plots increases for all methods, which does not depend on the presence or absence of outliers. This pattern is commonly reported in similar studies (Chaves et al., 2016CHAVES, A.G.S.; DRESCHER, R.; CALDEIRA, S.F.; MARTINEZ, D.T.; VENDRUSCOLO, D.G.S. Capacidade produtiva de Tectona grandis L.f no Sudoeste de Mato Grosso. Scientia Forestalis, v.44, p.415-424, 2016. DOI: https://doi.org/10.18671/scifor.v44n110.14.
https://doi.org/10.18671/scifor.v44n110....
) and occurs because stability is greater in more advanced ages, represented here by the two last measurements.
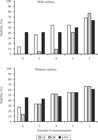
Percentage of stable plots according to the considered amount of recent measurements of eucalyptus (Eucalyptus spp.) stands, in databases with and without outliers. LR, linear regression; QR, quantile regression; and ANN, artificial neural network.
Although better results were expected for the QR with the presence of outliers in the database, the opposite occurred when five and four measurements were considered. These discrepancies were caused by one plot, in each case. In the first one, the site index estimates for the QR were 30.27 m for class 32.5 m, and, for the LR, they were 29.95 m for class 27.5 m; in the second, for the QR, they were 30.10 m for class 32.5 m and, for the LR, 29.96 m for class 27.5 m.
Conclusions
-
The artificial neural network (ANN) is a robust technique to cope with the presence of outliers in databases, and can be used for the classification of the productive capacity of even-aged eucalyptus (Eucalyptus spp.) stands.
-
A better stability in the classification of forest sites can be obtained using the ANN, both with the presence or absence of outliers.
References
- ABELLANAS, B.; ABELLANAS, M.; POMMERENING, A.; LODARES, D.; CUADROS, S. A forest simulation approach using weighted Voronoi diagrams. An application to Mediterranean fir Abies pinsapo Boiss stands. Forest Systems, v.25, p.1-16, 2016. DOI: https://doi.org/10.5424/fs/2016252-08021.
» https://doi.org/10.5424/fs/2016252-08021 - ARAÚJO JÚNIOR, C.A.; SOARES, C.P.B.; LEITE, H.G. Curvas de índices de local em povoamentos de eucalipto obtidas por regressão quantílica. Pesquisa Agropecuária Brasileira, v.51, p.720-727, 2016. DOI: https://doi.org/10.1590/S0100-204X2016000600003.
» https://doi.org/10.1590/S0100-204X2016000600003 - ASSMAN, E. The principles of forest yield study: studies in the organic production, structure, increment and yield of forest stands. Oxford: Pergamon Press, 1970. 506p.
- BINOTI, D.H.B.; BINOTI, M.L.M. da S.; LEITE, H.G. Aplicação da função hiperbólica na construção de curvas de índice de local. Revista Árvore, v.36, p.741-746, 2012. DOI: https://doi.org/10.1590/S0100-67622012000400015.
» https://doi.org/10.1590/S0100-67622012000400015 - BINOTI, D.H.B.; BINOTI, M.L.M. da S.; LEITE, H.G. Configuração de redes neurais artificiais para estimação do volume de árvores. Ciência da Madeira, v.5, p.58-67, 2014. DOI: https://doi.org/10.12953/2177-6830.v05n01a06.
» https://doi.org/10.12953/2177-6830.v05n01a06 - BINOTI, M.L.M. da S.; LEITE, H.G.; BINOTI, D.H.B.; GLERIANI, J.M. Prognose em nível de povoamento de clones de eucalipto empregando redes neurais artificiais. Cerne, v.21, p.97-105, 2015. DOI: https://doi.org/10.1590/01047760201521011153.
» https://doi.org/10.1590/01047760201521011153 - CAMPOS, J.C.C.; LEITE, H.G. Mensuração florestal: perguntas e respostas. 5.ed. atual. e ampl. Viçosa: Ed. da UFV, 2017. 636p.
- CHAVES, A.G.S.; DRESCHER, R.; CALDEIRA, S.F.; MARTINEZ, D.T.; VENDRUSCOLO, D.G.S. Capacidade produtiva de Tectona grandis L.f no Sudoeste de Mato Grosso. Scientia Forestalis, v.44, p.415-424, 2016. DOI: https://doi.org/10.18671/scifor.v44n110.14.
» https://doi.org/10.18671/scifor.v44n110.14 - COSENZA, D.N.; LEITE, H.G.; MARCATTI, G.E.; BINOTI, D.H.B.; ALCÂNTARA, A.E.M. de; RODE, R. Classificação da capacidade produtiva de sítios florestais utilizando máquina de vetor de suporte e rede neural artificial. Scientia Forestalis, v.43, p.955-963, 2015. DOI: https://doi.org/10.18671/scifor.v43n108.19.
» https://doi.org/10.18671/scifor.v43n108.19 - DEMOLINARI, R.A.; SOARES, C.P.B.; LEITE, H.G.; SOUZA, A.L. de. Crescimento de plantios clonais de eucalipto não desbastados na região de Monte Dourado (PA). Revista Árvore, v.31, p.503-512, 2007. DOI: https://doi.org/10.1590/S0100-67622007000300016.
» https://doi.org/10.1590/S0100-67622007000300016 - KOENKER, R. quantreg: quantile regression. R package version 5.05. 2013. Available at: <Available at: http://CRAN.R-project.org/package=quantreg >. Accessed on: Jan. 15 2018.
» http://CRAN.R-project.org/package=quantreg - KOENKER, R.; BASSETT JR., G. Regression quantiles. Econometrica, v.46, p.33-50, 1978.
- MACHADO, S. do A.; SOUZA, R.F. de; JASKIU, E.; CAVALHEIRO, R. Construction of site curves for native Mimosa scabrella stands in the metropolitan region of Curitiba. Cerne, v.17, p.489-497, 2011. DOI: https://doi.org/10.1590/S0104-77602011000400007.
» https://doi.org/10.1590/S0104-77602011000400007 - MCCULLOCH, W.S.; PITTS, W. A logical calculus of the ideas immanent in nervous activity. Bulletin of Mathematical Biophysics, v.5, p.115-133, 1943. DOI: https://doi.org/10.1007/BF02478259.
» https://doi.org/10.1007/BF02478259 - MIGUEL, E.P.; REZENDE, A.V.; LEAL, F.A.; MATRICARDI, E.A.T.; VALE, A.T. do; PEREIRA, R.S. Redes neurais artificiais para a modelagem do volume de madeira e biomassa do cerradão com dados de satélite. Pesquisa Agropecuária Brasileira, v.50, p.829-839, 2015. DOI: https://doi.org/10.1590/S0100-204X2015000900012.
» https://doi.org/10.1590/S0100-204X2015000900012 - R CORE TEAM. R: a language and environment for statistical computing. Vienna: R Foundation for Statistical Computing, 2014.
- SANTOS, A.J.A.; ANJOS, O.; PEREIRA, H. Estimation of Acacia melanoxylon unbleached Kraft pulp brightness by NIR spectroscopy. Forest Systems, v.24, eRC03, 2015. DOI: https://doi.org/10.5424/fs/2015242-07580.
» https://doi.org/10.5424/fs/2015242-07580 - SCHWERTMAN, N.C.; OWENS, M.A.; ADNAN, R. A simple more general boxplot method for identifying outliers. Computational Statistics & Data Analysis, v.47, p.165-174, 2004. DOI: https://doi.org/10.1016/j.csda.2003.10.012.
» https://doi.org/10.1016/j.csda.2003.10.012 - SCOLFORO, J.R.S. Biometria florestal: modelos de crescimento e produção florestal. Lavras: UFLA, 2006. 393p.
- SCOLFORO, J.R.S. Biometria florestal: módulo 3: métodos para classificação de sítios florestais. Lavras: UFLA, 1997. 151p.
- SOARES, C.P.B.; PAULA NETO, F. de; SOUZA, A.L. de. Dendrometria e inventário florestal. 2.ed. Viçosa: Ed. da UFV, 2011. 272p.
Publication Dates
-
Publication in this collection
27 May 2019 -
Date of issue
2019
History
-
Received
12 Feb 2018 -
Accepted
30 Oct 2018


