
Abstract
Finite/discrete element methods (FDEM) are hybrid numerical models that use algorithms to analyze the transition from continuous to discontinuous. This type of formulation allows modeling physical laboratory tests with greater proximity to reality. This article proposes to simulate the average behavior of a uniaxial compression test campaign. The tests were modeled and calibrated based on the strength and the fracture pattern using Geomechanica Inc. Irazu two-dimensional software. The simulated results were analyzed by the mean standard deviation of approximately 3000 elements in the middle third of the model, the same region where the clip gages are located in the physical test. The obtained results show that FDEM can replicate the laboratory test with great similarity.
Keywords:
Finite and Discrete element method; Hybrid numerical models; FDEM; FEM-DEM; UCS
1. Introduction
This study proposes to simulate laboratory tests of a meta-andesite using a hybrid numerical model - Finite Element Method / Discrete Element Method (FEM-DEM or FDEM). Uniaxial and diametral compression tests were carried out following the suggestions of the International Society of Rock Mechanics (ISRM) using a specimen diameter of 36 mm (ISRM establishes 54 mm) due to the on-site drilling equipment.
Numerical methods can be classified into continuous, discontinuous and hybrid. The hybrid algorithms are generally used in rock mechanics, mainly for the analysis of rock mass stress-strain behavior (JING, 2003JING, L. A review of techniques, advances and outstanding issues in numerical modelling for rock mechanics and rock engineering. International Journal of Rock Mechanics and Mining, v. 40, n. 3, p. 283-353, 2003.). The hybrid method FDEM was proposed by Munjiza et al. (1995) and modified for geomechanic applications by Mahabadi, et al. (2012MAHABADI, O. K. et al. Y-Geo: new combined finite-discrete element numerical code for geomechanical applications. International Journal of Geomechanics, v. 12, n.6, Mar. 2012.). One of the currently available software for rock mechanical modeling is the Geomechanica’s Irazu, used in this research.
The uniaxial compression strength (UCS) test is a physical test used to characterize the mechanical behavior of the intact rock. This test, described in Goodman (1989GOODMAN, R. E. Introduction to rock mechanics, New York: John Wiley, 1989.) and Brady and Brown (2004BRADY, B. H. G; BROWN, E. T. Rock mechanics for underground mining. New York: Kluwer Academic Publish, 2004.), is one of the most common procedures to directly define the intact rock strength, it's Young´s modulus and its Poisson ratio (Stefanizzi, et al., 2009STEFANIZZI, S. et al. Numerical modeling of standard rock mechanics laboratory tests using a finite/discrete element approach. In: CANADA-US ROCK MECHANICS SYMPOSIUM, 3.; CANADA ROCK MECHANICS SYMPOSIUM, 20., 2009, Toronto, Canada. Proceedings […]. Toronto: RockEng09, 2009.).
The simulation of Laboratory tests are discussed by some authors. Stefanizzi, et al. (2009STEFANIZZI, S. et al. Numerical modeling of standard rock mechanics laboratory tests using a finite/discrete element approach. In: CANADA-US ROCK MECHANICS SYMPOSIUM, 3.; CANADA ROCK MECHANICS SYMPOSIUM, 20., 2009, Toronto, Canada. Proceedings […]. Toronto: RockEng09, 2009.) use the ELFEN software to model uniaxial and diametral compression tests. Three-dimensional analyses of laboratory tests using FDEM code were carried out by Mahabadi, et al. (2014MAHABADI, O. et al. Three-dimensional FDEM numerical simulation of failure processes observed in Opalinus Clay laboratory samples. Journal of Rock Mechanics and Geotechnical Engineering, v. 6, n. 6, p. 1-16, 2014. and 2018). Mardaliza, et al. (2018) used the LS-Dyna to investigate the mechanical behavior of rocks by comparing the uniaxial compression tests performed in the laboratory and numerical model outputs.
The compression test simulation implemented in this study was based on the suggestions proposed by Tatone and Grasselli (2015TATONE, B. S. A.; GRASSELLI, G. A calibration procedure for two-dimensional laboratory-scale hybrid finite-discrete element simulations. International Journal of Rock Mechanics & Mining Sciences, v. 75, p. 56-72, 2015.). Initially, calibrations were carried out to define the mesh number of elements, the platten speed, the Viscous Damping factor, the contact penalties and finally the fracture energies. Subsequently, the meta-andesite UCS tests were simulated. The results were analyzed by the mean standard deviation of approximately 3000 elements in the middle third of the model, the same region where the clip gages are located in the physical test.
2. Material and methods
The Geomechanica’s Irazu software is a hierarchical modeling program combining the finite element and the discrete element methods. A detailed description of this methodology can be found in Munjiza (2004MUNJIZA, A. The combined finite-discrete element method. London: Jon Wiley & Sons, 2004.).
The steps of the simulations carried out by Irazu can be seen in Figure 1, including the pre and post-processing using open source tools such as Gmsh or Paraview.

Simulation steps and processes used in Irazu (Irazu,2018GEOMECHANICA. Irazu 2d Tutorial Manual. [S.l.: s. n.], 2018. p. 1-172.).
After defining and discretizing the domain using 3-node triangular elements, and assigning the initial and boundary conditions, a second order finite-difference integration is applied to solve the equation of motion at each time-step (Tatone and Grasselli, 2015TATONE, B. S. A.; GRASSELLI, G. A calibration procedure for two-dimensional laboratory-scale hybrid finite-discrete element simulations. International Journal of Rock Mechanics & Mining Sciences, v. 75, p. 56-72, 2015.):
Where M is the mass diagonal matrix; x the nodal displacements vector; F the nodal forces vector and C is the damping diagonal matrix. The solution of the equation requires a viscous damping parameter for energy dissipation. The matrix C can be described as:
Where µ is the viscous damping constant and I is the identity matrix (Tatone and Grasselli, 2015TATONE, B. S. A.; GRASSELLI, G. A calibration procedure for two-dimensional laboratory-scale hybrid finite-discrete element simulations. International Journal of Rock Mechanics & Mining Sciences, v. 75, p. 56-72, 2015.).
A major advance in the FEM-DEM method, proposed by Munjiza (2004MUNJIZA, A. The combined finite-discrete element method. London: Jon Wiley & Sons, 2004.), is the algorithm for detection of contact between elements. The interaction of numerous discrete elements requires fast and accurate contact detections. The algorithm NO BINARY SEARCH (NBS) computes the contacts by investigating if there is an overlap between elements and, in this case, creating repulsive and frictional forces when there is a slip between them. The method assumes that these forces are finite.
Mahabadi, et al. (2014MAHABADI, O. et al. Three-dimensional FDEM numerical simulation of failure processes observed in Opalinus Clay laboratory samples. Journal of Rock Mechanics and Geotechnical Engineering, v. 6, n. 6, p. 1-16, 2014.) recommended using contact penalties: (i) normal compression penalty, (ii) tangential shear penalty and (iii) fracture penalty for the traction. The suggestion for contact penalties is, approximately, 1 to 100 higher than the modulus of elasticity of the material.
The fractures are created according to the Morh-Coloumb failure criterion as a mechanical response to the induced stresses, thus allowing a transition from continuous to discontinuous (Mahabadi, 2012MAHABADI, O. K. et al. Y-Geo: new combined finite-discrete element numerical code for geomechanical applications. International Journal of Geomechanics, v. 12, n.6, Mar. 2012.). Irazu uses the concept of energy release rate (G) proposed by Irwin in 1956 (Chau, 2013CHAU, K. T. Analytic methods in geomechanics. New York: CRC Press, 2013.). The software defines 3 modes of fracture energy: the mode I for fracture opening (traction), the mode II for fracture shear and the mode III or mixed, when both phenomena occur. Figure 2 shows the modes I and II of fracture propagation.

(a) Conceptual model for mode I and II of fractures, (b) the theoretical model of fracture and (c) Numerical model FDEM (Tatone and Grasselli, 2015TATONE, B. S. A.; GRASSELLI, G. A calibration procedure for two-dimensional laboratory-scale hybrid finite-discrete element simulations. International Journal of Rock Mechanics & Mining Sciences, v. 75, p. 56-72, 2015.).
2.1 Model calibration
The model calibration was based on the work of Tatone and Grasselli (2015TATONE, B. S. A.; GRASSELLI, G. A calibration procedure for two-dimensional laboratory-scale hybrid finite-discrete element simulations. International Journal of Rock Mechanics & Mining Sciences, v. 75, p. 56-72, 2015.), following the steps: (a) definition of the domain, (b) definition of the elements size and, discretization, (c) determination of the platen velocity, (d) selection of the viscous damping, (e) selection of contact penalties, and, (f) definition of fracture energies. Tatone and Grasselli (2015)TATONE, B. S. A.; GRASSELLI, G. A calibration procedure for two-dimensional laboratory-scale hybrid finite-discrete element simulations. International Journal of Rock Mechanics & Mining Sciences, v. 75, p. 56-72, 2015. used an algorithm that is based on the force and displacement of the platens’ reaction. This study proposes a calibration methodology based on the Irazu’s output file. For each time step, the software prints the s1 mean and standard deviation of the selected elements. Before the specimen’s fracture, the standard deviation mean from each time step was used as the calibration parameter to ensure the most uniform uniaxial loading condition.
3. Results and discussion
Several properties obtained in the physical tests, such as density, Young’s modulus, Poisson ratio, tensile strength, cohesion, and internal friction angle, were used in the UCS test modeling. The shape of the rupture also assists in the calibration of the model. Table 1 shows the results obtained in the physical compression tests of the meta-andesite.
The results suggest the existence of two materials. A more resistant meta-andesite (UCS > 110 MPa) and another one less resistant (UCS < 65 MPa). The simulations were carried out considering the high resistance meta-andesite due to the higher number of tests (CP-3, CP-4, CP-5, and CP-6).
Therefore, the specimens mean dimensions, deformability and strength parameters were redefined as shown in Table 2. The density was obtained by the ratio between the mass and the volume of each specimen. Thirty measurements were carried out. The cohesion and the friction angle were obtained from triaxial tests. The tensile strength was estimated by thirty diametral tensile tests. Table 2 summarizes the specimen and the platen dimensions and properties used in the construction of the model.
Since the same velocity is assigned to each nodal point of the platen, it can be considered infinitely rigid, non-destructible, regardless of its mechanical properties (Irazu, 2018GEOMECHANICA. Irazu 2d Tutorial Manual. [S.l.: s. n.], 2018. p. 1-172.).
The specimen was deemed to be homogenous and isotropic. The hypothesis of plane stress was considered since the friction between the specimen and the platens was considered null. Figure 3 shows the initial model.

The integration time-increment was calculated according to the Irazu manual recommendations. All time-increments are smaller than the values recommended by Tatone and Grasselli (2015TATONE, B. S. A.; GRASSELLI, G. A calibration procedure for two-dimensional laboratory-scale hybrid finite-discrete element simulations. International Journal of Rock Mechanics & Mining Sciences, v. 75, p. 56-72, 2015.) to maintain the stability of the model.
3.1 Determination of the size of the elements
As a starting point and according to the suggestion of Tatone and Grasselli (2015TATONE, B. S. A.; GRASSELLI, G. A calibration procedure for two-dimensional laboratory-scale hybrid finite-discrete element simulations. International Journal of Rock Mechanics & Mining Sciences, v. 75, p. 56-72, 2015.), an automatic algorithm was used to define the size of the elements, using the following values: 0.65, 0.75, 0.85, 0.90, 1, 1.5, 2 mm. Figure 4 shows that the simulated UCS does not present a significant variation for the different sizes used. The difference between the highest and lowest UCS (6.82 MPa) represents 4.4% of the average strength.

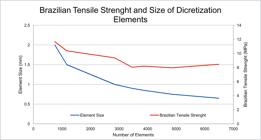
Tatone and Grasselli (2015TATONE, B. S. A.; GRASSELLI, G. A calibration procedure for two-dimensional laboratory-scale hybrid finite-discrete element simulations. International Journal of Rock Mechanics & Mining Sciences, v. 75, p. 56-72, 2015.) discussed that the discretization sensitivity analysis of the UCS model must be carried out in conjunction with the sensitivity analysis of the size of the elements of the Brazilian test model, also simulated by the authors. In the case of the Brazilian tensile strength (BTS) model, the number of elements in each discretization is approximately 4 times lower than in the UCS. Therefore, the impact of discretization in the simulation of the indirect tensile strength is considerably greater as shown in Figure 5. The tensile strength doesn’t show substantial variations for elements smaller than 0.75 mm. Hence, the chosen size of the elements was 0.75mm, which is the same as that proposed by Tatone and Grasselli (2015)TATONE, B. S. A.; GRASSELLI, G. A calibration procedure for two-dimensional laboratory-scale hybrid finite-discrete element simulations. International Journal of Rock Mechanics & Mining Sciences, v. 75, p. 56-72, 2015.. The greater the number of elements of the model, the greater the freedom for the fracture trajectory, however, the greater the computational demand.
3.2 Platten displacement velocity analysis
The axial loading in the UCS simulation is achieved by the platen displacement at a predetermined constant velocity (m/s), as a boundary condition. The velocity was evenly divided between the upper and lower platens. For values smaller than 0.25 m/s the model shows a convergence to a value of UCS of 150.50 MPa, on average. It should be noted that 0.25 m/s is significantly higher than the displacement rate observed in the laboratory tests. The final velocity of 0.06 m/s was chosen in order to ensure the quasi-static condition, with a reasonable computational time. Figure 6 shows the results to the simulations to verify this convergence (Tatone and Grasselli, 2015TATONE, B. S. A.; GRASSELLI, G. A calibration procedure for two-dimensional laboratory-scale hybrid finite-discrete element simulations. International Journal of Rock Mechanics & Mining Sciences, v. 75, p. 56-72, 2015.).

3.3 Viscous damping factor analysis
Assuming a triangular element in a mass-spring-dashpot system, the coefficient of critical viscous damping according to Irazu (2018)GEOMECHANICA. Irazu 2d Tutorial Manual. [S.l.: s. n.], 2018. p. 1-172. is estimated by:
Where h is the size, r is the density and E is the modulus of elasticity of the elements. Tatone and Grasselli (2015TATONE, B. S. A.; GRASSELLI, G. A calibration procedure for two-dimensional laboratory-scale hybrid finite-discrete element simulations. International Journal of Rock Mechanics & Mining Sciences, v. 75, p. 56-72, 2015.) suggest that the viscous damping factor is related to the linearity of the stress-strain curve, mainly at its beginning. The lower the viscous damping factor, the less the linearity at the beginning of the stress-strain curve. This behavior was not observed in this study, probably due to the difference in the analysis used. Tatone and Grasselli (2015)TATONE, B. S. A.; GRASSELLI, G. A calibration procedure for two-dimensional laboratory-scale hybrid finite-discrete element simulations. International Journal of Rock Mechanics & Mining Sciences, v. 75, p. 56-72, 2015. analysis is based on platen reactions while in this study the analysis was based on the actual middle third of the specimen. However, the smaller the viscous damping factor, the greater the principal stress (s1) mean standard deviation. Table 3 presents the UCS simulations response to several viscous damping factors. Eq. 3 renders the value 1 as the critical viscous damping, which also presents the lowest s1 standard deviation and, therefore, it was used in this study.
3.4 Contact penalty analysis
The analysis of the contact penalties was carried out by varying exponentially each penalty from 9.22x10¹⁰ to 9.22x10¹² Pa as proposed by Tatone and Grasselli (2015TATONE, B. S. A.; GRASSELLI, G. A calibration procedure for two-dimensional laboratory-scale hybrid finite-discrete element simulations. International Journal of Rock Mechanics & Mining Sciences, v. 75, p. 56-72, 2015.). The magnitude of 1013 was also simulated but did not generate a consistent result. The simulations show that the modulus of elasticity variation was 81 MPa. The contact penalties were chosen based on the lowest standard deviation of the principal stress (σ1): Fracture Penalty 9.22x10¹² (Pa); Normal Penalty 9.22x 10¹² (Pa.mm) and; Tangential Penalty 9.22x 10¹² (Pa/mm) attaining a principal stress average standard deviation of 416748 Pa or 0.4 MPa. Table 4 shows the simulation results; the numbers in Fracture, Normal and Tangencial penalties are the expoents used in the simulations.
3.5 Fracture energies analysis
The calibration of the fracture energies aimed to defined the two fracture modes: mode I and mode II (Tatone and Grasselli, 2015TATONE, B. S. A.; GRASSELLI, G. A calibration procedure for two-dimensional laboratory-scale hybrid finite-discrete element simulations. International Journal of Rock Mechanics & Mining Sciences, v. 75, p. 56-72, 2015.). The initial fracture energies used are the ones suggested by Irazu. These lithology simulations showed that the predominant fracture mode for UCS tests is mode II, associated with the shear mechanism. The variation of the mode I fracture energies, corresponding to the traction, did not affect the simulated resistance as observed in Figure 7.

A total of 82 scenarios were simulated to obtain the laboratory tests mean compressive strength of 134 MPa, finding a value of 45000 µN/mm for the mode II fracture energy. To refine this analysis and to find the conjugated mode I and mode II fracture energy, the results discussed by authors on the simulation of the Brazilian test were used. The combination of the results of the two calibrations yielded the fracture energies mode I and mode II of 16000 µN/mm and 40000 µN/mm, respectively. The uniaxial compressive strength calculated with these fracture energies was 134.17 MPa, which represents an error smaller than 0.15% when compared with the uniaxial compression strength obtained in the laboratory tests.
The Irazu manual suggests that the mode I should be 1 to 25 lower than mode II (Irazu, 2018GEOMECHANICA. Irazu 2d Tutorial Manual. [S.l.: s. n.], 2018. p. 1-172.). The ratio between the two energy fracture modes found in these calibrations is 2.5.
3.6 Uniaxial compression strength final simulation
The physical parameters calibrated in the previous steps were used for the simulation of the uniaxial compression test of a specimen with the mean dimensions of the actual specimens used in laboratory tests. Figure 8 shows three moments of the simulation and a picture of a characteristic test result.
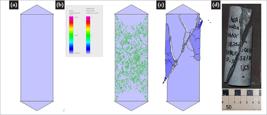
a) Model elastic behavior; b)Mode II predominant softening mode; c) Fractured UCS model d) Fractured sample in laboratory test - CP-03.
Figure 8 a) shows the modeled specimen and platens used in the simulation. The softening shown in Figure 8 b) is predominantly related to the fracture energy mode II (Shear) in agreement with the graph in Figure 7. Both instances concur that fracture energy mode I (Traction) does not significantly influence the rupture and consequently, does not influence the modeled uniaxial compression resistance. The shearing fracture pattern of the calibrated model resembles the actual discontinuity observed in the specimens used in the physical test (CP_03), as can be seen in Figure 8 c) and 8 d). As the software used (Irazu) is a 2D modeling tool, some differences are expected when the model is compared against the laboratory tests.
4. Conclusions
The discretization element sizes defined for the model are in accordance with the research of Tatone and Grasselli (2015TATONE, B. S. A.; GRASSELLI, G. A calibration procedure for two-dimensional laboratory-scale hybrid finite-discrete element simulations. International Journal of Rock Mechanics & Mining Sciences, v. 75, p. 56-72, 2015.). The size sensitivity analysis must be carried out in conjunction with the Brazilian test which presented a number of elements, approximately, 4 times smaller than in the uniaxial compression strength simulation. The smoothing factor of 0.75 was used in these simulations.
Platte velocities lower than 0.25 m/s returned a constant uniaxial compression resistance of approximately 150.5 MPa, which is also in agreement with the values proposed in the article of Tatone and Grasselli (2015TATONE, B. S. A.; GRASSELLI, G. A calibration procedure for two-dimensional laboratory-scale hybrid finite-discrete element simulations. International Journal of Rock Mechanics & Mining Sciences, v. 75, p. 56-72, 2015.). The chosen speed for each platten was 0.03 m/s resulting in a final velocity of 0.06 m/s, assuring a quasi-static condition while achieving a reasonable simulation time.
The viscous damping factor was simulated using the multiples of the calculated critical value. The nonlinearity at the beginning of the stress-strain curve as discussed by Tatone and Grasselli (2015TATONE, B. S. A.; GRASSELLI, G. A calibration procedure for two-dimensional laboratory-scale hybrid finite-discrete element simulations. International Journal of Rock Mechanics & Mining Sciences, v. 75, p. 56-72, 2015.) was not observed in the analyses carried out. Therefore, the mean standard deviation of the principal stress (s1) was used as a target. The lowest mean standard deviation (0.4 MPa) was attained for critical viscous damping factor. This result corroborates with the viscous damping used by Tatone and Grasselli (2015)TATONE, B. S. A.; GRASSELLI, G. A calibration procedure for two-dimensional laboratory-scale hybrid finite-discrete element simulations. International Journal of Rock Mechanics & Mining Sciences, v. 75, p. 56-72, 2015..
The analysis of the contact penalties did not show significant variations in the modulus of elasticity. The difference between the minimum and maximum values found was 81 MPa. Therefore, the choice of contact penalties was also based on the principal stress mean standard deviation (0.4 MPa) in this case.
The calibration of the fracture energies required a greater number of simulations. The values found for the calibration of fracture energies are 16000 µN/mm for mode I (Traction) and 4000 µN/mm for mode II (Shear). Mode II is 2.5 higher than Mode I, which corroborates with the suggestions of the Irazu manual.
The predominance of softening mode 2 (shear) at the final stages of the UCS modeling substantiate the results found in the calibration of the fracture energies, where the mode I (Traction) fracture energy has no significant influence on the UCS strength. The fracture pattern identified in the model (shearing) is consistent with the fracture pattern showed by the physical test specimens. Since the software used in the simulations is a two-dimensional modeling tool, the pattern of the rupture can show some differences as compared to the physical tests, due to the simplification to a 2D condition.
References
- BRADY, B. H. G; BROWN, E. T. Rock mechanics for underground mining New York: Kluwer Academic Publish, 2004.
- CHAU, K. T. Analytic methods in geomechanics New York: CRC Press, 2013.
- GEOMECHANICA. Irazu 2d Tutorial Manual [S.l.: s. n.], 2018. p. 1-172.
- GOODMAN, R. E. Introduction to rock mechanics, New York: John Wiley, 1989.
- JING, L. A review of techniques, advances and outstanding issues in numerical modelling for rock mechanics and rock engineering. International Journal of Rock Mechanics and Mining, v. 40, n. 3, p. 283-353, 2003.
- LISJAK, A. et al. Numerical modelling of the anisotropic mechanical behaviour of Opalinus Clay at the laboratory-scale using FEM/DEM. Rock Mechanics and Rock Engineering, v.4, n.1, p. 187-206, 2014.
- MAHABADI, K. O. Investigating the influence of micro-scale heterogeneity and microstructure on the failure and mechanical behavior of geomaterials 2012. 224 f. Thesis (Doctor in Civil Engineering) - Univesity of Toronto, Toronto, 2012.
- MAHABADI, O. et al. Three-dimensional FDEM numerical simulation of failure processes observed in Opalinus Clay laboratory samples. Journal of Rock Mechanics and Geotechnical Engineering, v. 6, n. 6, p. 1-16, 2014.
- MAHABADI, O. K. et al. Y-Geo: new combined finite-discrete element numerical code for geomechanical applications. International Journal of Geomechanics, v. 12, n.6, Mar. 2012.
- MARDALIZAD, A. et al. Testing and numerical simulation of a medium strength rock material under unconfined compression loading. Journal of Rock Mechanics and Geotechnical Engineering, v. 10, n.2, p. 197-211, 2018.
- MUNIJZA, A.; OWEN, D. R. J.; BICANIC, N. A combined finite-discrete element method in transient dynamics of fracturing solids. Engineering Computations, v.12, n.2, p. 145-174, 1995.
- MUNJIZA, A. The combined finite-discrete element method London: Jon Wiley & Sons, 2004.
- STEFANIZZI, S. et al. Numerical modeling of standard rock mechanics laboratory tests using a finite/discrete element approach. In: CANADA-US ROCK MECHANICS SYMPOSIUM, 3.; CANADA ROCK MECHANICS SYMPOSIUM, 20., 2009, Toronto, Canada. Proceedings […] Toronto: RockEng09, 2009.
- TATONE, B. S. A.; GRASSELLI, G. A calibration procedure for two-dimensional laboratory-scale hybrid finite-discrete element simulations. International Journal of Rock Mechanics & Mining Sciences, v. 75, p. 56-72, 2015.
Publication Dates
-
Publication in this collection
30 Sept 2020 -
Date of issue
Oct-Dec 2020
History
-
Received
07 June 2019 -
Accepted
06 May 2020


