Abstract
High yield stability and adaptability of yellow passion fruit varieties (Passiflora edulis Sims. f. flavicarpa Deg.) are highly desirable attributes when exploring different environments. This study aimed to evaluate the adaptability and yield stability of yellow passion fruit varieties using AMMI (additive main effects and multiplicative interaction) and other ancillary statistics. Twelve varieties were evaluated in eight environments. Analysis of variance showed effects attributable to the varieties (G), environment (E) and their interaction (G × E). The first two multiplicative components of the interaction accounted for 69% of the sum of squares. The scores of the principal interaction components showed high variability for the environments relative to the variety effects. High varietal phenotypic stability was observed in three environments; which can be used in yellow passion fruit breeding programs for initial selection trials. A biplot-AMMI analysis and yield stability index incorporating the AMMI stability value and yield capacity in a single non-parametric index were useful for discriminating genotypes with superior and stable fruit yield. AMMI analysis also allowed for the identification of more productive varieties in specific environments, leading to significant increase in passion fruit productivity.
GENETICS AND PLANT BREEDING
AMMI analysis of the adaptability and yield stability of yellow passion fruit varieties
Eder Jorge de OliveiraI,* * Corresponding author < eder.oliveira@embrapa.br> ; Juan Paulo Xavier de FreitasII; Onildo Nunes de JesusI
IEmbrapa Cassava & Fruits, R. Embrapa, s/n, C.P. 007 44380-000 Cruz das Almas, BA Brazil
IIFederal University of Bahia Reconcavo, R. Rui Barbosa, 710 44380-000 Cruz das Almas, BA Brazil
ABSTRACT
High yield stability and adaptability of yellow passion fruit varieties (Passiflora edulis Sims. f. flavicarpa Deg.) are highly desirable attributes when exploring different environments. This study aimed to evaluate the adaptability and yield stability of yellow passion fruit varieties using AMMI (additive main effects and multiplicative interaction) and other ancillary statistics. Twelve varieties were evaluated in eight environments. Analysis of variance showed effects attributable to the varieties (G), environment (E) and their interaction (G × E). The first two multiplicative components of the interaction accounted for 69% of the sum of squares. The scores of the principal interaction components showed high variability for the environments relative to the variety effects. High varietal phenotypic stability was observed in three environments; which can be used in yellow passion fruit breeding programs for initial selection trials. A biplot-AMMI analysis and yield stability index incorporating the AMMI stability value and yield capacity in a single non-parametric index were useful for discriminating genotypes with superior and stable fruit yield. AMMI analysis also allowed for the identification of more productive varieties in specific environments, leading to significant increase in passion fruit productivity.
Introduction
The yellow passion fruit (Passiflora edulis Sims. f. flavicarpa Deg.) is currently grown in almost all regions in Brazil, and accounts for 95 % of the area where this crop is grown. Yellow passion fruit is cultivated under different environmental conditions in Brazil due in part to crop expansion, but primarily to the itinerant aspects that characterize the crop, especially in relation to several pests and diseases. However, there are few studies in the literature on passion fruit production yield and stability in different regions.
Yellow passion fruit yield is dependent on genetic and environmental factors, in which the interaction between the genotype and environment (G × E) reduces the association between genotypic and phenotypic components. For a long time, G × E interaction has been the primary theme in plant breeding because it assists breeders in one of the most critical steps in this process, which is the determination of which varieties should be recommended. Several statistical methods have been developed to characterize and minimize the effect of the G × E interaction in selected varieties and to predict phenotypic responses to environmental changes. However, most statistical stability methods are not able to provide an accurate and complete variety response pattern for this interaction (Holhs, 1995), especially because the genotype response to environmental variation is multivariate (Lin et al., 1986) and most stability indices have a univariate response (Crossa, 1990).
Analysis of variance (ANOVA) is merely an additive model in which the G × E interaction is a source of variation, but its intrinsic effects are not analyzed. In contrast, principal component analysis (PCA) is a multiplicative model and, therefore, does not present additive main effects for the environment nor genotype. However, the newly developed AMMI (additive main effects and multiplicative interaction) analysis includes ANOVA and PCA in a unified approach that can be used to analyze multiple yield trials (Zobel et al., 1988; Crossa et al., 1990; Gauch and Zobel, 1996). AMMI uses ANOVA to test the main effects of genotypes and environments, and PCA to analyze the residual multiplicative interaction between genotypes and environments to determine the sum of squares of the G × E interaction, with a minimum number of degrees of freedom. Because ANOVA and PCA are part of the AMMI model, this model is likely more suitable for characterizing the G × E interaction (Zobel et al., 1988).
This study aimed to estimate the adaptability and yield stability of yellow passion fruit varieties using AMMI analysis and auxiliary non-parametric statistics to select varieties that have both high performance and phenotypic stability in reducing the G × E interaction effects and make the selection of varieties more refined and precise.
Materials and Methods
Yield trials
The experiments were carried out in eight agronomic production areas in the State of Bahia, Brazil (Table 1). Planting was completed in 2009/2010 during the rainy season for each region. The spacing was 2.6 m between rows and 3.7 m between plants. A vertical system for the canopy was used, with a single strand of galvanized wire (14 gauge) 2 m above the ground. Twelve varieties of yellow passion fruit from the breeding program at Embrapa Cassava and Fruits, were evaluated.
Experimental design
Experiments were carried out in a randomized block design with three replicates and ten plants per plot, following all recommended cultivation practices for passion fruit. The fruit yield data per plot were acquired over the first year of production (between 7 and 20 months after planting).
AMMI analysis
An initial analysis of variance was performed for each environment to verify the existence of differences between varieties. After these analyses, the homogeneity between residual variances was determined, and a joint analysis of variance was used to test the genotype and environment effects and the magnitude of the G × E interaction. AMMI analysis was used to adjust the main or additive genotype and environmental effects by analysis of variance, in addition to the adjustment of the multiplicative effects for the G × E interaction by principal component analysis. The AMMI model was as follows:

where Yij is the fruit yield of the ith variety in the jth environment, µ is the overall mean, gi and ej are the fixed varietal effects and environmental deviations, respectively, λk is a singular value of the K axis in the principal component analysis, γik and δjk are genotype and environmental factors, respectively, of the singular vectors associated with λk from the interaction matrix, N is the number of principal components retained in the model,ρij is the residual G × E interaction, and eij is the average independently assumed error εij ~N(0, σ2).
The sum of squares of the G × E interaction was divided into an n singular axis or Interaction Principal Component Axis (IPCA), which reflects the standard portion in which each axis corresponded to a particular AMMI model. The selection of a model that best describes the G × E interaction was based on the FR test as proposed by Cornelius et al. (1992).
Once the AMMI model had been selected, we investigated the adaptability and phenotypic stability using biplot graphs. Biplot graph interpretation is based on the variation of the additive main effects (genotype and environment) and the multiplier effect of the G × E interaction. The abscissa represents the main effects (average of varieties evaluated), and the ordinate the interaction among the axes (IPCA). In this case, the lower the IPCA value (absolute value) the lower the contribution of the G × E interaction and the greater the genotype stability. An ideal genotype is one with a high yield and IPCA values close to zero. An undesirable genotype is one with low stability, which is associated with low yields. The average predictions were estimated according to the AMMI model selected. All statistical analyses were performed using the AMMI procedure in R (R Development Core Team, version 3.0.1).
AMMI stability value (ASV)
The AMMI stability value was calculated as previously described by Purchase et al. (2000):

, where  is the weight derived from dividing the sum of IPCA1 squares by the sum of IPCA2 squares. The larger the absolute value of IPCA, the greater the adaptability of a specific variety for a certain environment. Conversely, lower ASV values indicate greater stability in different environments.
Sustainability Index (SuI)
The sustainability index was calculated as previously described by Babarmanzoor et al. (2009):

where Y is the average performance of a specific variety, σn the standard deviation and YM the value of the best genotype in any environment. The sustainability index values were arbitrarily divided into three stability groups as follows: low (up to 35 %), medium (36 to 70 %) and high (71 to 100 %).
Stability index (StI)
The stability index from the non-parametric stability analysis by Rao et al. (2004) was calculated as follows:

where is the average yield of the ith variety,
  the overall mean,
  the variance in the ith stability variety (Shukla, 1972), and n the number of environments.
Yield stability index (YSI)
The yield stability index was calculated using the following formula: YSI = RASV + R , where RASV is the ranking of the AMMI stability value and RP the ranking of yellow passion fruit yields in all environments.
Results and Discussion
Analysis of fruit yields in different environments
The joint analysis of variance showed differences (p < 0.01) for environments (E), genotypes (G) and the G × E interaction (Table 2). The experimental coefficient of variation for the joint analysis was low (16%), indicating good experimental precision. A significant effect of the G × E interaction demonstrates the differential performance of genotypes in different environments. Therefore, this change in the average yield of yellow passion fruit varieties as a consequence of the environment justifies the need for a more refined analysis to increase selection efficiency and varietal recommendations.
An alternative strategy for reducing the G × E interaction involves a genotype selection with greater stability within a wide range of environments, which facilitates the prediction of their behavior. Therefore, AMMI analysis is an important tool for increasing our knowledge of the factors involved in the G × E interaction.
AMMI analysis of the G×E interaction
The AMMI method is widely used in stability and adaptability analyses because it i) provides an initial diagnosis of the model and is well-suited for data analysis with many environmental influences, ii) allows greater unfolding of the G × E interaction and summarizes the patterns and relationships between genotypes and environments, and iii) improves the accuracy of trait estimates (Gauch, 1988; Zobel et al., 1988; Crossa et al., 1990).
An AMMI analysis of yellow passion fruit yield in eight production environments in the State of Bahia showed that 61% of the sum of squares was explained by the environment, and 5% and 34% were attributable to the genotype effects and the G × E interaction, respectively (Table 2). The large environmental percentage for the sum of squares indicates the significant differences between the averages of some environments, which caused most of the variation in the fruit yield of yellow passion fruit. Similar results were observed in peanuts, in which most of the variation (93 %) was attributable to environmental factors and the G × E interaction, demonstrating that selecting the best genotypes is not an easy task (Oliveira and Godoy, 2006).
The AMMI model retrieves the part of the sum of squares (SQG × E) that determines the G × E interaction, which is called the standard portion (the genotype and environment effect), and a residual part, which corresponds to unpredictable and uninterpretable responses from the model (Cornelius et al., 1996). Thus, the genetic variation can be explained by the different AMMI models. Based on the FR test, the IPCA4 was the last with non-significant residue (p < 0.01) (Table 2), which provides guidance as to the selection of the AMMI3 model to explain the G × E interaction effect. In addition, 69% of the sum of squares of the interaction can be explained by the AMMI2 model, with 50% and 19% explained by IPCA1 and IPCA2, respectively. The values explained by these models were higher than those observed in other crops, such as sugar cane and peanuts (Oliveira and Godoy, 2006; Silveira et al., 2013).
Stability and adaptability analysis
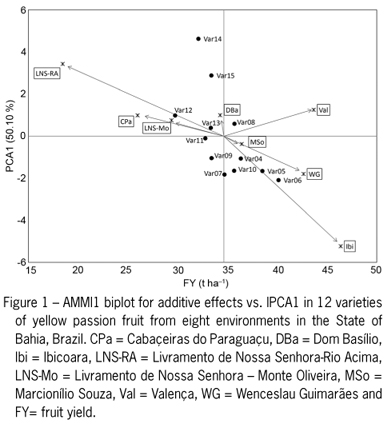
Biplot graphs of the AMMI1 (IPCA1 vs. additive effects from varieties and environment) and AMMI2 models (IPCA2 vs. IPCA1) are in Figures 1 and 2, respectively. The Livramento de Nossa Senhora - Rio Acima (LNS-RA), Cabaçeiras do Paraguaçu (CPa), Livramento de Nossa Senhora Monte Oliveira (LNS-Mo) and Dom Basílio (DBa) environments produced the lowest yields of yellow passion fruit. Moreover, the environmental effect scores were more scattered than the varietal effect scores, indicating that variability due to the environment is greater than variability caused by varietal effects (Figure 1).
According to Duarte and Vencovsky (1999), stability is evaluated in the y-axis (IPCA1) by AMMI1, whilst AMMI2 analysis revealed stable environments and genotypes located near the origin, with low scores for the two axes of the interaction (IPCA1 and IPCA2). Accordingly, varieties 08, 11 and 13 were the most stable, as indicated by values near the origin of the IPCA1 axis, which is indicative of a smaller contribution to the G × E interaction (Figure 1). However, varieties 11 and 13 had fruit yields lower than the overall mean and are, therefore, not ideal. In contrast, varieties 14 and 15 were the most unstable, with fruit yields lower than the overall mean. Similarly, varieties 05 and 06 were unstable, but presented high fruit yields. Varieties 04, 07, 09, 10 and 12 presented intermediate stability. Moreover, variety 06 presented not only high average fruit yield, but also high IPCA value, indicating adaptability specific to the Wenceslau Guimarães (WG) environment.
As regards the environment, we can highlight the smallest contribution to the interaction in the Marcionílio Souza (MSo) and LNS-Mo regions. Other environments presented an intermediate (CPa and DBa) or high (LNS-RA, Valença - Val, WG and Ibicoara - Ibi) contribution to the G×E interaction (Figure 1). Environmental stability is important for demonstrating the reliability of genotype ordering in a given environment in relation to the rating for the environments in question (Rocha et al., 2007). In the case of yellow passion fruit, average fruit yields were higher than the overall mean in only the Val, MSo, WG and Ibi environments, which accounted for 34.65 t ha1. The main reason for the high fruit yield in these environments is likely related to the better availability and distribution of rainfall in these regions or the use of irrigation systems, as was the case in Ibi and Mso during the initial establishment and flowering phases.
Based on the AMMI2 analysis, varieties 11, 12 and 13 were found to be the most stable (Figure 2). However, variety 08 was considered stable based on AMMI1 analysis, but was highly unstable according to AMMI2 analysis. Behavior inversions in relation to the classification of genotypes in AMMI1 and AMMI2 biplot were also observed in other crops, such as cowpea (Rocha et al., 2007). In the current situation, information from the AMMI2 biplot may be more accurate given that this model contains IPCA1 and IPCA2 information and, therefore, contains a greater pattern portion compared to the AMMI1 biplot, which considers only the IPCA1. Moreover, the classification of variety 12 was changed from intermediate stability after AMMI1 analysis to high stability after AMMI2 analysis. Varieties 06, 07, 08, 14 and 15 appeared very unstable based on their significant distance from the origin of the biplot graph.
Based on AMMI2 analysis, the DBa, Val and LNSMo environments were the main contributors to the phenotypic stability of the varieties (Figure 2). Furthermore, the LNS-Mo and Val environments showed no significant differences in fruit yield between the varieties (Table 3). In contrast, the Ibi, LNS-RA and WG environments made a significant contribution to the G × E interaction, since they were positioned away from the origin of the AMMI2 biplot. In general, genotypes and environments in close proximity on the biplot graph have positive associations, which certainly facilitate the creation of more similar agronomic performance zones. As an example, variety 06 is found in the WG environment, and variety 12 is in the DBa environment. Other lower specific associations can be observed, such as variety 13 in the CPa environment (Figure 2).
AMMI analysis does not provide a quantitative measure of stability. For this reason, Purchase et al. (2000) proposed an ASV measure to quantify and classify genotypes according to their yield stability in that ASV is the distance of the varieties from point zero of the scatter diagram (IPCA1 vs. IPCA2). Although the IPCA1 score contributes more to the sum of squares for the G × E interaction, it must be weighted by the proportional difference between the scores of IPCA1 and IPCA2 in order to compensate for the relative contribution of IPCA1 and IPCA2 to the total sum of squares of the interaction. Therefore, varieties 04, 08, 09, 11, 12 and 13 presented lower scores and therefore, were considered to be more stable (Table 4). The ASV parameter has been used as an auxiliary criterion to define more stable genotypes in other crops such as wheat (Farshadfar et al., 2011) and rice (Das et al., 2010).
The most stable varieties according to the YSI were 04, 05 and 08 (Table 4). The YSI method incorporates both yield and stability into a single index, reducing the problem of using only yield stability as the sole criterion to select varieties, taking into account that the most stable genotypes do not always have the best yield performance (Oliveira and Godoy, 2006). Accordingly, the YSI parameter associated with genotype classification is based on the ASV parameter (which accounts for IPCA1 and IPCA2), and the ranking of varieties is based on fruit yield. This method has been successfully used in other crops, such as wheat (Farshadfar, 2008), in which the authors stated that this criterion agreed with the biplot analysis.
The sustainability index of each variety is presented in Table 4. Most yellow passion fruit varieties were classified as having median sustainability (ranging from 40 to 70%), and varieties 05 and 06 showed high sustainability (75.01 and 76.98, respectively). The high SuI values coincided with high fruit yield from varieties 05 and 06. However, this index has not been adequate for discriminating stable genotypes with high grain yield in wheat (Mladenov et al., 2012). Similar results were also obtained for wheat by Farshadfar et al. (2011), with sustainability indices higher than 91 % reported for some genotypes.
Yellow passion fruit varieties were ranked on the basis of StI in decreasing order. The results showed that the StI from the 12 yellow passion fruit varieties were very similar, with varieties 05 and 06 presenting indices above 62.00 (Table 4). The StI overcomes some of the methodical disadvantages based on genotype ranking, which causes a bias in the selection of the most productive genotypes (Bajpai and Prabhakaran, 2000). Based on this finding, the StI stability and fruit yield of the genotypes are measured on the basis of individual performance relative to the average performance of the genotypes evaluated. This trend was observed in the current study, as varieties 05 and 06 were deemed more stable and also presented the highest fruit yields.
Environmental classification
The main purpose of this stability analysis is to identify yellow passion fruit varieties with wide geographic adaptation, high agronomic performance and high fruit yield (preferably above the overall mean of 34.65 t ha1) in heterogeneous environments. Because it can be difficult to identify a perfect variety, the identification of varieties with specific adaptations can be extremely useful for more regionalized varietal recommendations.
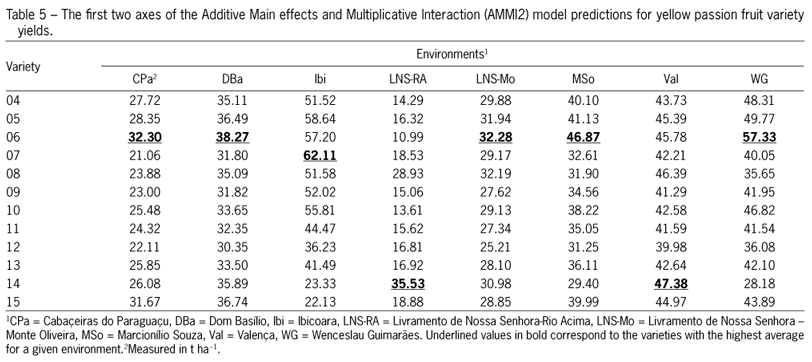
The classification of environments based on higher-performance genotypes (means for fruit yield) in each environment facilitated the identification of five mega environments (variety 05 in the DBa and LNS-Mo environments; variety 06 in the MSo, Val and WG environments; variety 07 in the Ibi environment; variety 14 in the LNS-RA environment; and variety 15 in the CPa environment) (Table 3). In contrast, this same classification based on the AMMI2 model (predicted means for fruit yield) allowed for the identification of only three mega environments (Table 5). The first included the CPa, DBa, LNS-Mo, MSo and WG environments, with variety 06 having the highest fruit yield. The second mega environment was Ibi, in which variety 07 had the best performance. Lastly, the third mega environment consisted of LNS-Ra and WG, with variety 14 as the most productive (Table 5). The superiority of mega environments formed from the mean fruit yield can be attributed to the portion of noise incorporated into estimates of raw data (Silveira et al., 2013). Such noise is usually reduced during AMMI2 analysis, ultimately ensuring fewer mistakes in cultivar recommendations.
Conclusions
Because of the greater phenotypic stability the DBa, Val and LNS-Mo environments can be used during the initial stages of selecting new yellow passion fruit varieties.
A graphical interpretation of the AMMI analysis and YSI index incorporating the ASV and the yield capacity of the different varieties in a single non-parametric index were useful for discriminating genotypes with superior and stable fruit yield.
Although the use of different methods to estimate the stability and adaptability of select yellow passion fruit varieties has led to controversial results, varieties 04 and 05 were generally the most stable when considering the average of the eight environments based on different methods, in addition to their high yield potential.
When selecting yellow passion fruit varieties that are more productive in certain environments variety 06 presented high adaptability to the MSo, Val and WG environments, leading to an improvement of passion fruit productivity in specific regions.
Acknowledgments
To Bahia State Foundation for Research Support (Fapesb) and National Counsil for Scientific and Technological Development (CNPq), for their financial assistance and scholarship support.
Received July 16, 2013
Accepted October 26, 2013
Edited by: Leonardo Oliveira Medici
- Babarmanzoor, A.; Tariq, M.S.; Ghulam, A.; Muhammad, A. 2009. Genotype × environment interaction for seed yield in Kabuli Chickpea (Cicer arietinum L.) genotypes developed through mutation breeding. Pakistan Journal of Botany 41: 1883-1890.
- Bajpai, P.K.; Prabhakaran T. 2000. A new procedure of simultaneous selection for high yielding and stable crop genotypes. The Indian Journal of Genetics and Plant Breeding 60: 141-146.
- Cornelius, P.L.; Crossa, J.; Seyedsadr, M.S. 1996. Statistical tests and estimators of multiplicative models for genotype-byenvironment interaction. p. 199-234. In: Kang, M.S.; Gauch, H.G., eds. Genotype-by-environment interaction. CRC Press, Boca Raton, FL, USA.
- Cornelius, P.L.; Seyedsadr, M.; Crossa, J. 1992. Using the shifted multiplicative model to search for "separability" in crop cultivar trials. Theoretical and Applied Genetics 84: 161-172.
- Crossa, J.; Gauch, H.G.; Zobel, R.W. 1990. Additive main effect and multiplicative interaction analysis of two international maize cultivar trials. Crop Science 30: 493-500.
- Crossa, J. 1990. Statistical analysis of multilocation trials. Advances in Agronomy 44: 55-85.
- Das, S.; Misra, R.C.; Patnaik, M.C.; Das, S.R. 2010. G×E interaction, adaptability and yield stability of mid-early rice genotypes. The Indian Journal of Agricultural Research 44: 104-111.
- Duarte, J.B.; Vencovsky, R. 1999. Genotype × environment interaction: an introduction to AMMI analysis = Interação genótipos × ambientes: uma introdução à análise AMMI. Sociedade Brasileira de Genética, Ribeirão Preto, SP, Brazil (in Portuguese).
- FAO. Soil map of the world. Revised legend with corrections. Rome: FAO; UNESCO; Wageningen: ISRIC, 1994. 140p. (World Resources Report, 60)
- Farshadfar, E. 2008. Incorporation of AMMI stability value and grain yield in a single non-parametric index (GSI) in bread wheat. Pakistan Journal of Biological Science 11: 1791-1796.
- Farshadfar, E.; Mahmodi, N.; Yaghotipoor, A. 2011. AMMI stability value and simultaneous estimation of yield and yield stability in bread wheat (Triticum aestivum L.). Australasian Journal of Crop Science 5: 1837-1844.
- Gauch, H.G.; Zobel, R.W. 1996. AMMI analysis of yield trials. p. 85-122. In: Kang, M.S.; Gauch, H.G., eds. Genotype-byenvironment interaction. CRC Press, Boca Raton, FL, USA.
- Gauch, H.G. 1988. Model selection and validation for yield trials with interaction. Biometrics 44: 705-715.
- Holhs, T. 1995. Analysis of genotype environment interactions. South African Journal of Science 91: 121-124.
- Lin, C.S.; Binns, M.R.; Lefkovitch, L.P. 1986. Stability analysis: where do we stand? Crop Science 26: 894-900.
- Mladenov, V.; Banjac, B.; Miloevic, M. 2012. Evaluation of yield and seed requirements stability of bread wheat (Triticum aestivum L.) via AMMI model. Turkish Journal of Field Crops 17: 203-207.
- Oliveira, E.J.; Godoy, I.J. 2006. Pod yield stability analysis of runner peanut lines using AMMI. Crop Breeding and Applied Biotechnology 6: 311-317.
- Purchase, J.L.; Hatting, H.; Vandeventer, C.S. 2000. Genotype × environment interaction of winter wheat (Triticum aestivum L.) in South Africa. II. Stability analysis of yield performance. South African Journal of Plant and Soil 17: 101-107.
- Rao, M.; Lakshmikantha, R.G.; Kulkarni, R.S.; Lalitha, R.S.S.; Ramesh, S. 2004. Stability analysis of sunflower hybrids through non-parametric model. Helia 27: 59-66.
- Rocha, M.M.; Freire Filho, F.R.; Ribeiro, V.Q.; Carvalho, H.W.L.; Belarmino Filho, J.; Raposo, J.A.A.; Alcântara, J.P.; Ramos, S.R.R.; Machado, C.F. 2007. Yield adaptability and stability of semi-erect cowpea genotypes in the Brazil Northeast Region. Pesquisa Agropecuária Brasileira 42: 1283-1289 (in Portuguese, with abstract in English).
- Shukla, G.K. 1972. Some statistical aspects of partitioning genotype-environmental components of variability. Heredity 29: 237-245.
- Silveira, L.C.I.; Kist, V.; Paula, T.O.M.; Barbosa, M.H.P.; Peternelli, L.A.; Daros, E. 2013. AMMI analysis to evaluate the adaptability and phenotypic stability of sugarcane genotypes. Scientia Agricola 70: 27-32.
- Zobel, R.W.; Wright, M.J.; Gauch, H.G. 1988. Statistical analysis of a yield trial. Agronomy Journal 80: 388-393.
Publication Dates
-
Publication in this collection
14 Apr 2014 -
Date of issue
Apr 2014
History
-
Accepted
26 Oct 2013 -
Received
16 July 2013